Unlock a world of possibilities! Login now and discover the exclusive benefits awaiting you.
- Qlik Community
- :
- Forums
- :
- Analytics
- :
- New to Qlik Analytics
- :
- Re: Lead-to-deal
- Subscribe to RSS Feed
- Mark Topic as New
- Mark Topic as Read
- Float this Topic for Current User
- Bookmark
- Subscribe
- Mute
- Printer Friendly Page
- Mark as New
- Bookmark
- Subscribe
- Mute
- Subscribe to RSS Feed
- Permalink
- Report Inappropriate Content
Lead-to-deal
Hey guys,
back with another problem... so i have the following tables: Leads, salesmen and deals. I have made an drill-down table for my incoming leads (year, month, date). And i also made an other table to see how many leads each of my salesmen get. But now i want to know how many deals were made in a month. but if i drill-down in the incoming leads chart and click on Oktober i only get to see the deals where the lead came in in Oktober. if a lead came in in September and the deal was closed in Oktober i cannot see that deal. Is there some kind of expression where i can select all of my deals made in a month? Because right now i cannot calculate my lead-to-deal speed and the conversion rate of a specific month ...
Jonnie
- Mark as New
- Bookmark
- Subscribe
- Mute
- Subscribe to RSS Feed
- Permalink
- Report Inappropriate Content
You can use Set Analysis in your expression to limit the dates or other criteria that it calculates based on.
So the user could pick Lead Year 2016 from your filter. But the expression would only Sum or Count deals with a close date of 2017 for example.
I would need a better understanding of your data and exactly what you are trying to accomplish to give you a more specific answer.
- Mark as New
- Bookmark
- Subscribe
- Mute
- Subscribe to RSS Feed
- Permalink
- Report Inappropriate Content
Hi Jonnie,
As suggested above it certainly possible to achieve what is described above, but to advised better we would need some more details. If you have any sample data, if you could then show what you are currently see and what you expect to see.
In a situation like this I would normally create multiple calendars to drive the dates depending on what I select, but it can get a little complicated.
here is a little more information on this
Mark
- Mark as New
- Bookmark
- Subscribe
- Mute
- Subscribe to RSS Feed
- Permalink
- Report Inappropriate Content
Mark,
I have made some dummy data (3 tables in a excelsheet. Leads, deals and salesman) see attached file. Hope u can do something with this... Also you will see attached a screenshot of the data. The bar-chart and the pie-chart are correct, but one of the KPI's is incorrect. Its true i have 8 leads but i didnt have 5 deals.. i have 0 in September... 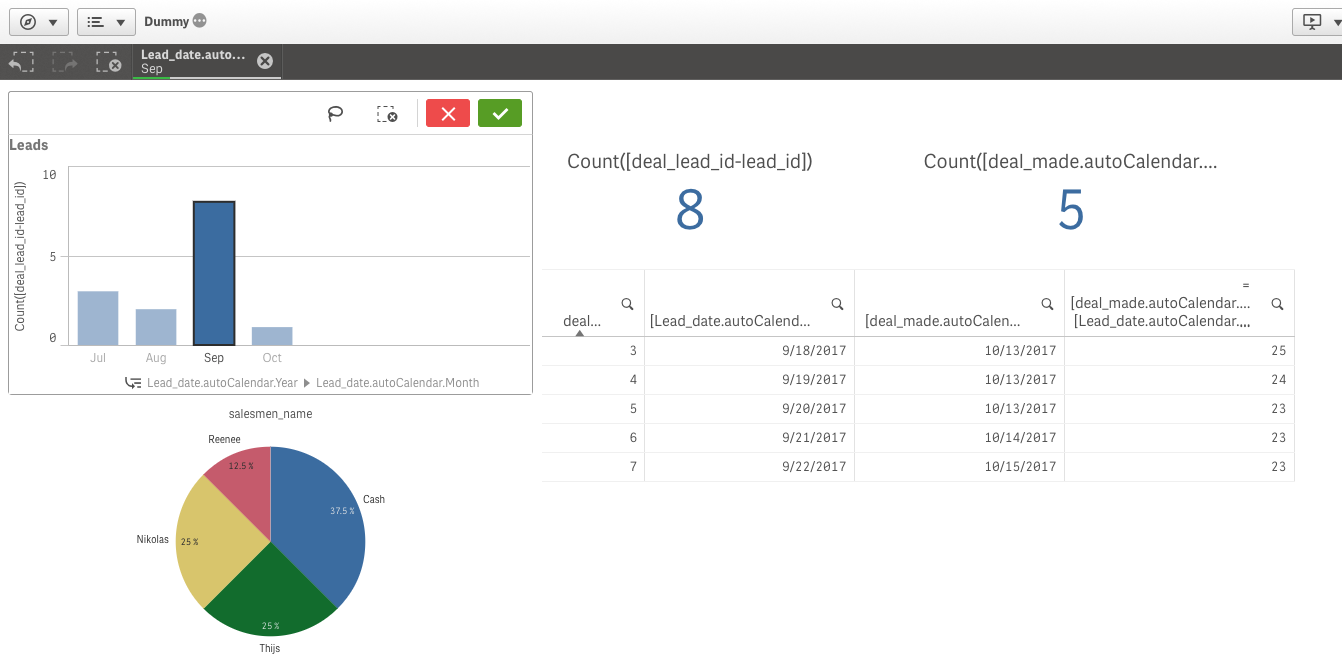
- Mark as New
- Bookmark
- Subscribe
- Mute
- Subscribe to RSS Feed
- Permalink
- Report Inappropriate Content
The problem is that your lead date as nothing to do with your deal date.
How are your tables associated in the data model?
If you want to see all leads for October 2017 and at the same time All deals then you need to use Set Analysis in the Deals expression to ignore all filters or at least ignore the lead date filter. Then it would display the total leads for that month in one KPI and the total deals ignoring that filter (or all deals).
- Mark as New
- Bookmark
- Subscribe
- Mute
- Subscribe to RSS Feed
- Permalink
- Report Inappropriate Content
Mark,
It is true that my lead date has nothing to do with my deal date (of cource only when i want to calculate my lead-to-deal speed in days). But thats exactly what i want!!! Just clicking on a month and shows the total of leads AND deals... How can i do this using Set Analysis??
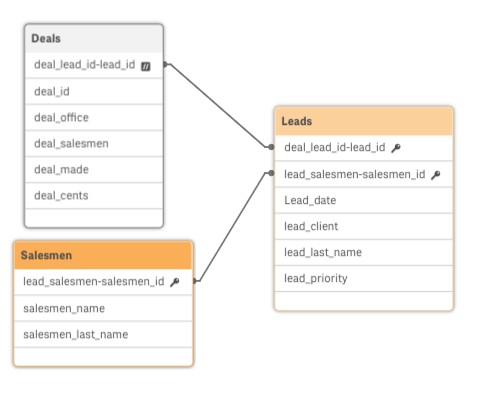
My tables are associated like this (also in the real data model)
- Mark as New
- Bookmark
- Subscribe
- Mute
- Subscribe to RSS Feed
- Permalink
- Report Inappropriate Content
Hi there,
Approached in a different manner. I have just concatenated the two data table to make a fact and counted where relevant. Take a look at the attached app.
Mark
- Mark as New
- Bookmark
- Subscribe
- Mute
- Subscribe to RSS Feed
- Permalink
- Report Inappropriate Content
Mark,
That is the solution! But i have no idea how you did it... I tried changing the script a few times, but when i did that my data-model blew up and i needed to delete everything and import the data again (using REST controller).
- Mark as New
- Bookmark
- Subscribe
- Mute
- Subscribe to RSS Feed
- Permalink
- Report Inappropriate Content
HI Jonnie,
All I am doing is Concatenating your Lead and Deal Table into one Fact Table.
First I add a new column Type, so can know what is a Deal and what is Lead. (Needed in the Set Analysis)
Then rename fields in both tables where they are same
So the Sales Person ID (Lead_Salesmen on Lead and Deal_Salesmen on Deal)
Then the dates (Lead_date on Lead and deal_made on Deal)
No sure what is happening with your data model, If you give me some more information on what your changed and I can advise further.
Mark
- Mark as New
- Bookmark
- Subscribe
- Mute
- Subscribe to RSS Feed
- Permalink
- Report Inappropriate Content
This is my data-model right now. I really don't want to change anything in my script so im trying to use Set Analysis.
These are the measures/dimension i use in my BarChart to count the incoming leads:
Dimension:
[lead_binnenkomst.autoCalendar.Year]
[lead_binnenkomst.autoCalendar.Month]
[lead_binnenkomst.autoCalender.Date]
Measure:
count(
{$-1<
[lead_source]={"via verhuurder"},
[lead_binnenkomst.autoCalendar.Date]= {">=02/14/2017"} > }
[lead_id-lead_source_id]
)
BarChart 2 i use fto count the leads per salesmen:
Dimension: =verkoper_voornaam
Measure: same measure as above
Now the measure is not entirly correct... It shows me the leads without "via verhuurder' but it shows me all the leads from 2011 till now... and for the salesmen it doesnt show me which lead belongs to which salesmen unless i change lead_source to lead_binnenkomst.autoCalandar.Date.
And for the deals KPI im trying something like this: Count({$<[deal_id]={'*'}, [lead_binnenkomst.autoCalendar.Date] > } [lead_id-lead_source_id]) but no result
