Unlock a world of possibilities! Login now and discover the exclusive benefits awaiting you.
- Qlik Community
- :
- Forums
- :
- Analytics
- :
- New to Qlik Analytics
- :
- Re: Limit Line Chart Measure - Stop values from pl...
- Subscribe to RSS Feed
- Mark Topic as New
- Mark Topic as Read
- Float this Topic for Current User
- Bookmark
- Subscribe
- Mute
- Printer Friendly Page
- Mark as New
- Bookmark
- Subscribe
- Mute
- Subscribe to RSS Feed
- Permalink
- Report Inappropriate Content
Limit Line Chart Measure - Stop values from plotting
Hi stalwar1
You helped me with an issue I was having before and I would be grateful for your input here!
I have an issue that I have been struggling with for some time.
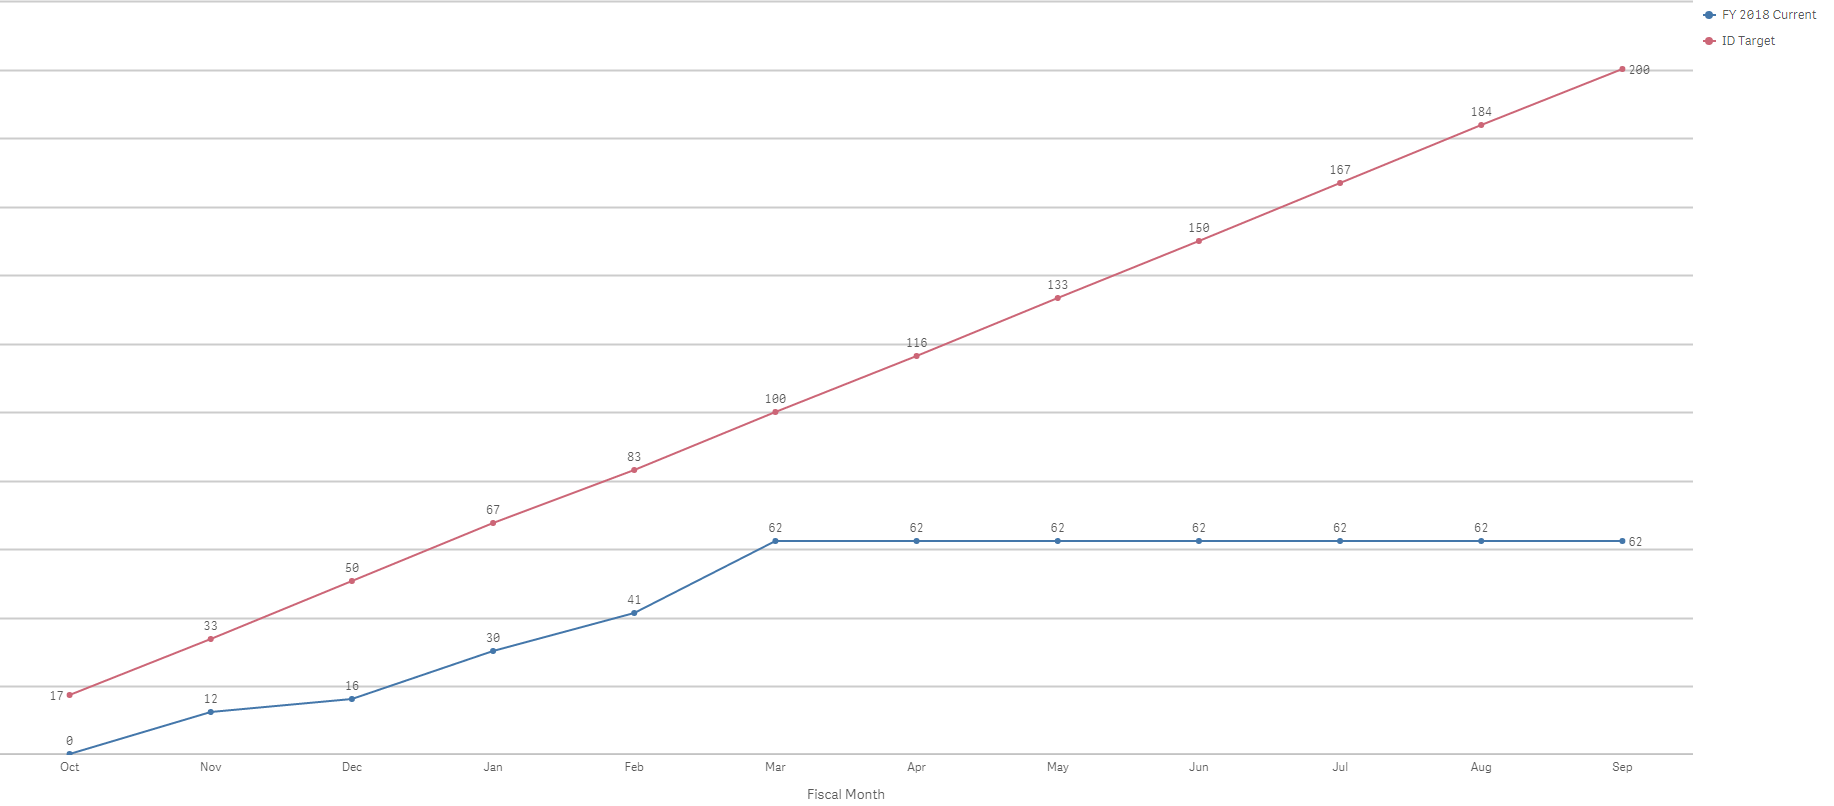
I've attached a QVF as well as a snapshot PNG of what the only sheet in this app looks like.
ALL I need is to limit the measure labelled 'FY 2018', which is colored 'Blue'. I want the rangesum to calculate to the current month (April) and then STOP - No more line. However, I have been unable to find a way to script this into my set analysis. Furthermore, the 'ID Target' trend line needs to remain as is, going from 0 to 200 from October to September.
Note: Even if I change the set analysis to include a more dynamic date range for the 'Blue' measure, it still calculates whatever the value is and applies it to every month from now until September: {$<IDENTIFIED_DATE={'>$(=date(vFY2018Start))<=$(=date(today())) }>}
Regards,
Ben
- Mark as New
- Bookmark
- Subscribe
- Mute
- Subscribe to RSS Feed
- Permalink
- Report Inappropriate Content
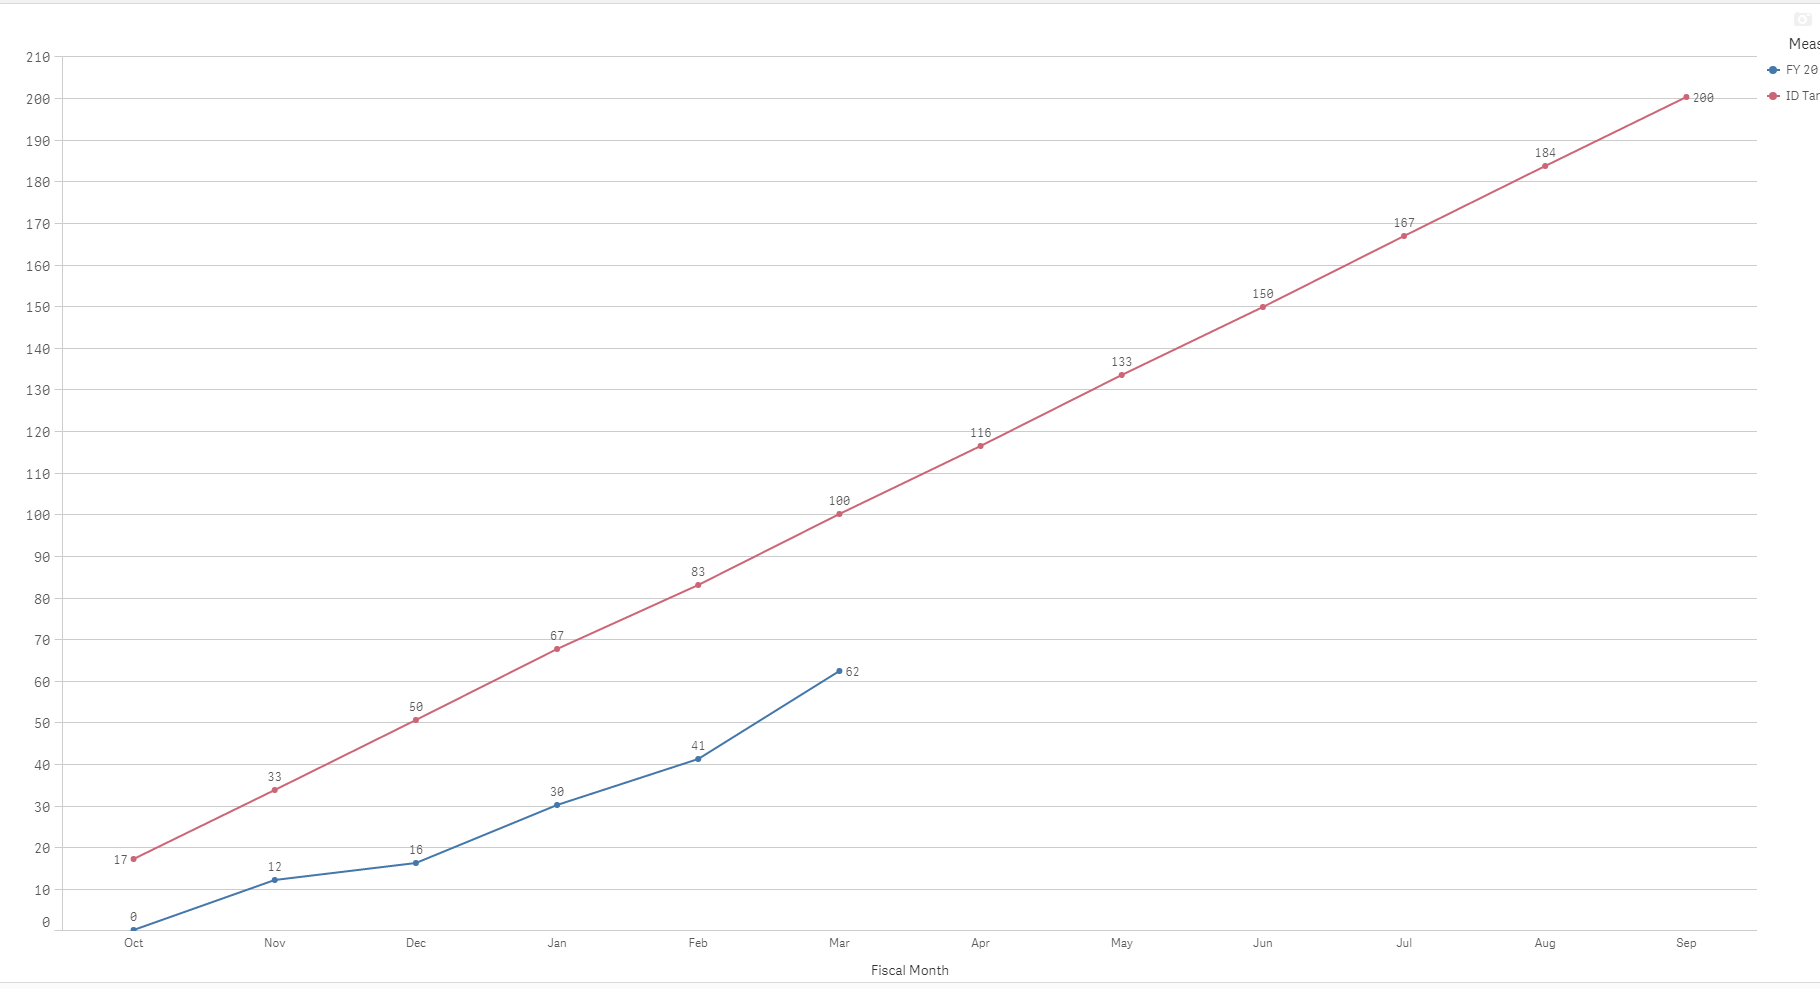
change ur expression:
from rangesum(bla bla)
to:
if(sum(Measure)=0,0,rangesum(bla bla))
- Mark as New
- Bookmark
- Subscribe
- Mute
- Subscribe to RSS Feed
- Permalink
- Report Inappropriate Content
May be try this
If(FMonth <= Max(TOTAL {$<[IDENTIFIED_DATE]={*}, FYear={'FY2018'}>} FMonth),
RangeSum(Above(Count({$<[IDENTIFIED_DATE]={*}, FYear={'FY2018'}>} [IDENTIFIED_DATE]), 0, RowNo())))
- Mark as New
- Bookmark
- Subscribe
- Mute
- Subscribe to RSS Feed
- Permalink
- Report Inappropriate Content
Genius!
It works perfectly.
Thanks Sunny.