Unlock a world of possibilities! Login now and discover the exclusive benefits awaiting you.
- Qlik Community
- :
- Forums
- :
- Analytics
- :
- New to Qlik Analytics
- :
- Line Chart Two Colors on one Line
- Subscribe to RSS Feed
- Mark Topic as New
- Mark Topic as Read
- Float this Topic for Current User
- Bookmark
- Subscribe
- Mute
- Printer Friendly Page
- Mark as New
- Bookmark
- Subscribe
- Mute
- Subscribe to RSS Feed
- Permalink
- Report Inappropriate Content
Line Chart Two Colors on one Line
EDIT: I have added a (poorly imaged 😂) picture of my desired result for better understanding.
Hi Qlik Pros,
i am having a hard time editing my line chart. Maybe you guys can help me?
Objective:
Merge red and blue lines but keeping the colors to show how the amount is put together.
Reason:
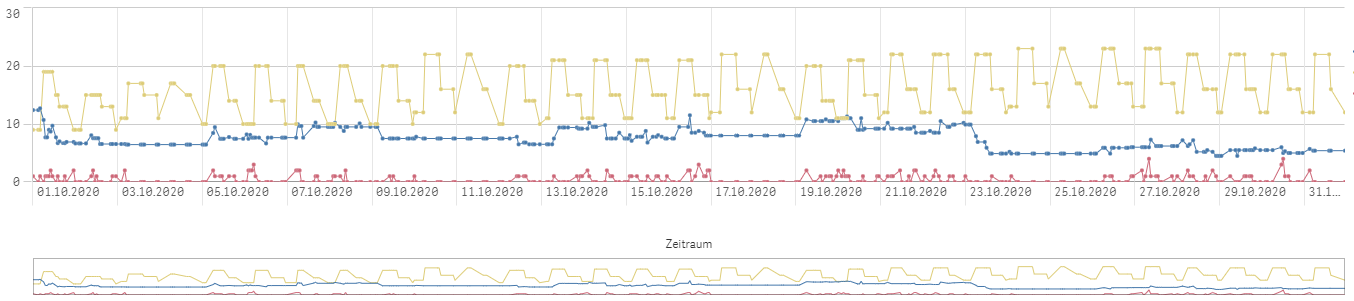
I am building an app for our productions department to keep track of the amount of workers required over time to wait our mashines. On the image attached you can see a yellow line that shows how many workers are available at the time shown on my X-Axis. The blue and red lines represent two kinds work and the amount of workers that are needed to get it done. The problem is, that it is not clear how many workers are needed in total since there are two separate lines. I am afraid that it could lead to misunderstanding and therefore not enough workers in each shift.
I am working with Qlik Sense Enterprise June 2020 Patch 2.
Every help is appreciated!
Thank you very much,
Can
- Tags:
- line chart
- sense
- Mark as New
- Bookmark
- Subscribe
- Mute
- Subscribe to RSS Feed
- Permalink
- Report Inappropriate Content
assuming a simple chart with DATE dimension, M1 and M2 measures, try this:
exp1: if(sum(M1)<>0, sum(M1))
esp2: if(sum(M2)<>0, sum(M2))
to get the lines connected, the measures should overlap, example, if M1 starts at 1/1/2020 and ends 1/10/2020, M2 should also start at 1/10/2020 and the sum of both on 1/10/2020 should be the same otherwise they will not connect. otherwise you need more complex logic that tests is either sum is zero, what the other measure should be. but the idea is there, make the expression null if the other expression has a value
also in presentation show missing as gaps
- Mark as New
- Bookmark
- Subscribe
- Mute
- Subscribe to RSS Feed
- Permalink
- Report Inappropriate Content
Hi Edwin,
thanks for replying to my post and your advice. I have tried to transfer your suggestions on my problem but unfortunately it didn't work for me because usually both measures can have values at the same time since they are two different types of work that need to be done on a mashine at the same time. I have been able to get something together that might be a temporarily fix for my problem.
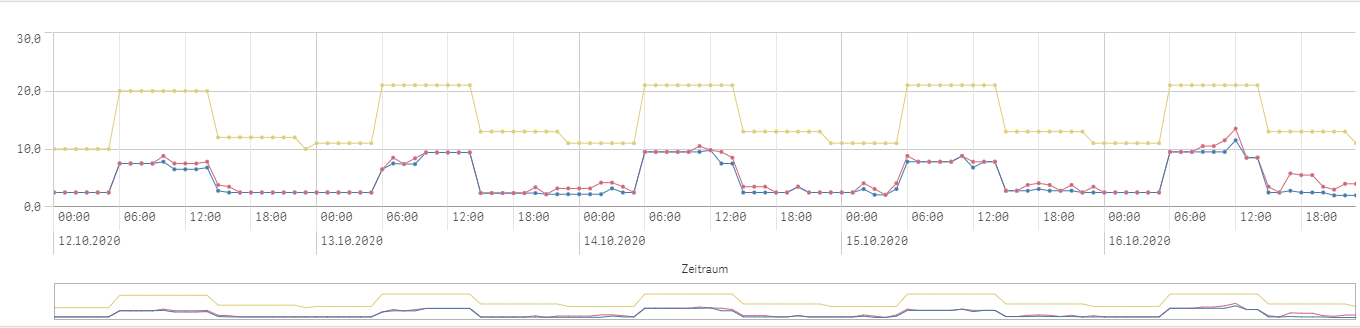
I overlapped the lines by adding the value of measure 1 to measure 2 like this:
Line 1: Sum(M1)
Line 2: Sum(M1) + Sum(M2)
In that way both lines are always overlapping except M2 has a value. You can see the result on the attached image. It might not be the best looking way but at least it is easier to see how much your demand is and how it is put together.
Again, thank your for helping me Edwin.