Unlock a world of possibilities! Login now and discover the exclusive benefits awaiting you.
- Qlik Community
- :
- Forums
- :
- Analytics
- :
- New to Qlik Analytics
- :
- Re: Line chart dimension keep showing time instead...
- Subscribe to RSS Feed
- Mark Topic as New
- Mark Topic as Read
- Float this Topic for Current User
- Bookmark
- Subscribe
- Mute
- Printer Friendly Page
- Mark as New
- Bookmark
- Subscribe
- Mute
- Subscribe to RSS Feed
- Permalink
- Report Inappropriate Content
Line chart dimension keep showing time instead of month
Hi Guys,
My data model is very simple.
Just one table and 3 columns. It looks something like this
| Month Year | Product Name | Total Sales |
|---|---|---|
| 01-05-2017 | Milk | 500 |
| 01-05-2017 | Bread | 600 |
| 01-06-2017 | Milk | 700 |
| 01-06-2017 | Bread | 900 |
| 01-07-2017 | Milk | 300 |
| 01-07-2017 | Bread | 500 |
(Date Format: DD-MM-YYYY)
When I create a line chart in qlik sense and select [Month Year] as dimension.. then it automatically converts it into YYYY-MM-DD HH:MM:SS
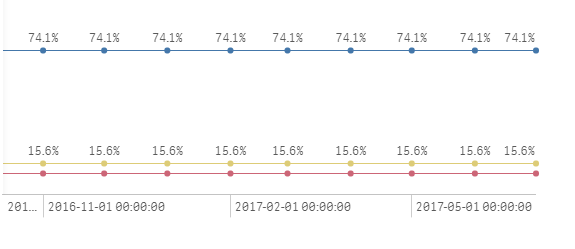
How to ensure that the dimension would only show as month year (MMM-YY) ?
I have tried putting dimension as =Date([Month Year],'MMM-YY') but still does not work
- Tags:
- lline chart
Accepted Solutions
- Mark as New
- Bookmark
- Subscribe
- Mute
- Subscribe to RSS Feed
- Permalink
- Report Inappropriate Content
Hi Lokesh,
Please check the X-axis Continuous option.
Put Continuous option in Auto mode.
You will find this option under
Appearance -> X-axis.
Ishan
- Mark as New
- Bookmark
- Subscribe
- Mute
- Subscribe to RSS Feed
- Permalink
- Report Inappropriate Content
Hi
Try this
Date(Date#([Month Year],'DD-MM-YYYY'),'MMM-YY')
- Mark as New
- Bookmark
- Subscribe
- Mute
- Subscribe to RSS Feed
- Permalink
- Report Inappropriate Content
Hi Lokesh,
Please check the X-axis Continuous option.
Put Continuous option in Auto mode.
You will find this option under
Appearance -> X-axis.
Ishan
- Mark as New
- Bookmark
- Subscribe
- Mute
- Subscribe to RSS Feed
- Permalink
- Report Inappropriate Content
Hi Lokesh,
Try this in script,
Date(Floor(Num(Date)),'MMM-YY') as [Month Year]
you can also use ceil instead of Floor based on your requirement.
Ishan