Unlock a world of possibilities! Login now and discover the exclusive benefits awaiting you.
- Qlik Community
- :
- Forums
- :
- Analytics
- :
- New to Qlik Analytics
- :
- Re: Line chart fit to the window
- Subscribe to RSS Feed
- Mark Topic as New
- Mark Topic as Read
- Float this Topic for Current User
- Bookmark
- Subscribe
- Mute
- Printer Friendly Page
- Mark as New
- Bookmark
- Subscribe
- Mute
- Subscribe to RSS Feed
- Permalink
- Report Inappropriate Content
Line chart fit to the window
HI,
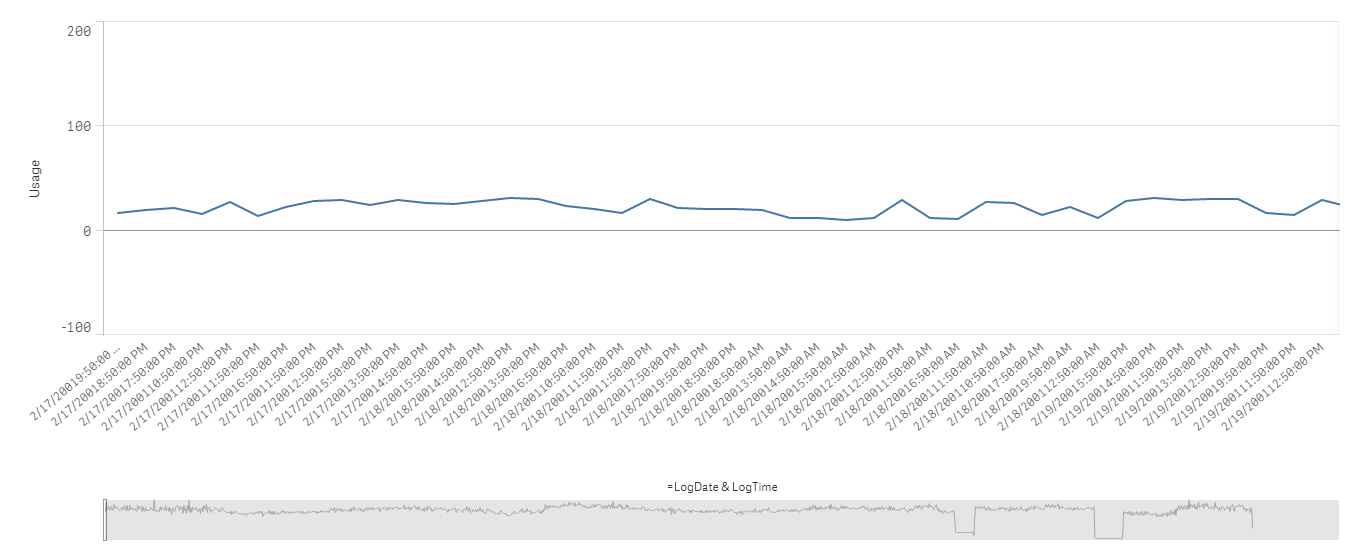
I am Charting memory usage from Log file(5 years data) in QS. I would like to know, is there any way that I can see whole chart at once, rather than moving the highlighter around..
As you can see in the below window , Even to analyze at least a week data , need move highlighter. Since data is huge highlighting specific area is becoming tedious
- Mark as New
- Bookmark
- Subscribe
- Mute
- Subscribe to RSS Feed
- Permalink
- Report Inappropriate Content
Hi Guruprem,
Currently this is not possible due to the responsive-design nature of the chart objects.
Can you attach your .qvf file, I want to try something with another visualization?
Perhaps an extension object can be created at branch.qlik.com. http://branch.qlik.com/
Please mark the appropriate replies as CORRECT / HELPFUL so our team and other members know that your question(s) has been answered to your satisfaction.
Regards,
Mike Tarallo
Qlik
Mike Tarallo
Qlik
- Mark as New
- Bookmark
- Subscribe
- Mute
- Subscribe to RSS Feed
- Permalink
- Report Inappropriate Content
Hi,
Currently it is not possible because of responsive design, Can you try by keeping only one chart in this sheet? So that in a whole sheet this can fit.
Regards,
Jagan.