Unlock a world of possibilities! Login now and discover the exclusive benefits awaiting you.
- Qlik Community
- :
- Forums
- :
- Analytics
- :
- New to Qlik Analytics
- :
- Re: Linest_b, linest_m, tables and multiplications
- Subscribe to RSS Feed
- Mark Topic as New
- Mark Topic as Read
- Float this Topic for Current User
- Bookmark
- Subscribe
- Mute
- Printer Friendly Page
- Mark as New
- Bookmark
- Subscribe
- Mute
- Subscribe to RSS Feed
- Permalink
- Report Inappropriate Content
Linest_b, linest_m, tables and multiplications
Hi community,
a very fast question. I'm using the nice Linest_b function.
My dataset is something like:
load*inline
[a,x,y
a,3,4
b,4,5
c,5,9
d,7,1
];
So I need to have a table with this simple result
| a | x | y | y*beta |
|---|---|---|---|
| a | 3 | 4 | (x)-linest_b(x,y)-LINEST_M(x,y)*(y) |
| b | 4 | 5 | (x)-linest_b(x,y)-LINEST_M(x,y)*(y) |
| c | 5 | 9 | (x)-linest_b(x,y)-LINEST_M(x,y)*(y) |
| d | 7 | 1 | (x)-linest_b(x,y)-LINEST_M(x,y)*(y) |
But I cannot manage to have a result, everything goes grey. I've tried also to do something like
(x)-num(linest_b(x,y))-num(LINEST_M(x,y))*(y)
or
sum(x)-num(linest_b(x,y))-num(LINEST_M(x,y))*sum(y)
But nothing happened but to have an useless total.
Could I ask you an help?
Thanks in advance
EDIT:
Due further developements, it is, I'm using the model with y,x , not x,y. The reasoning are the same.
- « Previous Replies
-
- 1
- 2
- Next Replies »
Accepted Solutions
- Mark as New
- Bookmark
- Subscribe
- Mute
- Subscribe to RSS Feed
- Permalink
- Report Inappropriate Content
- Mark as New
- Bookmark
- Subscribe
- Mute
- Subscribe to RSS Feed
- Permalink
- Report Inappropriate Content
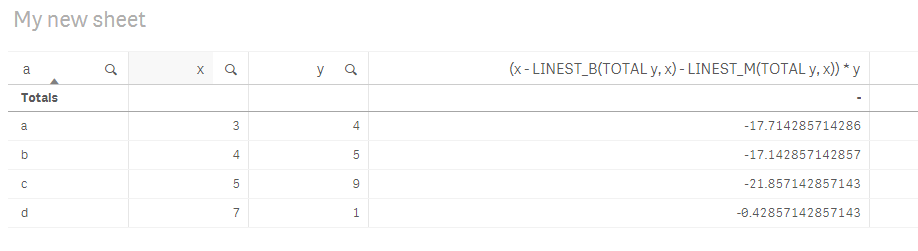
May be this?
(x - LINEST_B(TOTAL y, x) - LINEST_M(TOTAL y, x)) * y
- Mark as New
- Bookmark
- Subscribe
- Mute
- Subscribe to RSS Feed
- Permalink
- Report Inappropriate Content
Hi Simone,
have you tried something like LINEST_B(TOTAL x,y)?
BR
Martin
- Mark as New
- Bookmark
- Subscribe
- Mute
- Subscribe to RSS Feed
- Permalink
- Report Inappropriate Content
Awesome as usual!! Thanks!
- Mark as New
- Bookmark
- Subscribe
- Mute
- Subscribe to RSS Feed
- Permalink
- Report Inappropriate Content
If I can ask,
how could put it in a histogram?
- Mark as New
- Bookmark
- Subscribe
- Mute
- Subscribe to RSS Feed
- Permalink
- Report Inappropriate Content
First of all, do you agree with the numbers? I not not even sure if you get the right numerical output or not
- Mark as New
- Bookmark
- Subscribe
- Mute
- Subscribe to RSS Feed
- Permalink
- Report Inappropriate Content
I've double checked the formulae (qlik sense, theory and R) and it is better in this way
y-(linest_b( total y,x))-(LINEST_M(total y,x))*x
However the issue was the TOTAL, whom saves my day.
- Mark as New
- Bookmark
- Subscribe
- Mute
- Subscribe to RSS Feed
- Permalink
- Report Inappropriate Content
Hi Simone,
use bar chart object, insert add Dimension: x-(linest_b( total x,y))-(LINEST_M(total x,y))*y as Dimension, and put Count(a) as Expression.
BR
Martin
- Mark as New
- Bookmark
- Subscribe
- Mute
- Subscribe to RSS Feed
- Permalink
- Report Inappropriate Content
Hi Martin,
thanks. I'd like to use the Qlik Sense Histogram, not a barchart. It needs only one "field", nor a dimension, neither a measure specifically. Using a barchart works technically, bit it is going to count "one" for each value of the dimension, making it not useable. Generally a Histogram should have only a measure and you can vary the width of the bins.
- Mark as New
- Bookmark
- Subscribe
- Mute
- Subscribe to RSS Feed
- Permalink
- Report Inappropriate Content
May be create a new field in the script and use that to create your histogram
Table:
LOAD * INLINE [
a, x, y
a, 3, 4
b, 4, 5
c, 5, 9
d, 7, 1
];
Left Join (Table)
LOAD LINEST_B(x,y) as b,
LINEST_M(x,y) as m
Resident Table;
FinalTable:
LOAD *,
x-b-m*y as z
Resident Table;
DROP Table Table;
Now use z to create your histogram
- « Previous Replies
-
- 1
- 2
- Next Replies »