Unlock a world of possibilities! Login now and discover the exclusive benefits awaiting you.
- Qlik Community
- :
- Forums
- :
- Analytics
- :
- New to Qlik Analytics
- :
- Re: Map object
- Subscribe to RSS Feed
- Mark Topic as New
- Mark Topic as Read
- Float this Topic for Current User
- Bookmark
- Subscribe
- Mute
- Printer Friendly Page
- Mark as New
- Bookmark
- Subscribe
- Mute
- Subscribe to RSS Feed
- Permalink
- Report Inappropriate Content
Map object
Hi All,
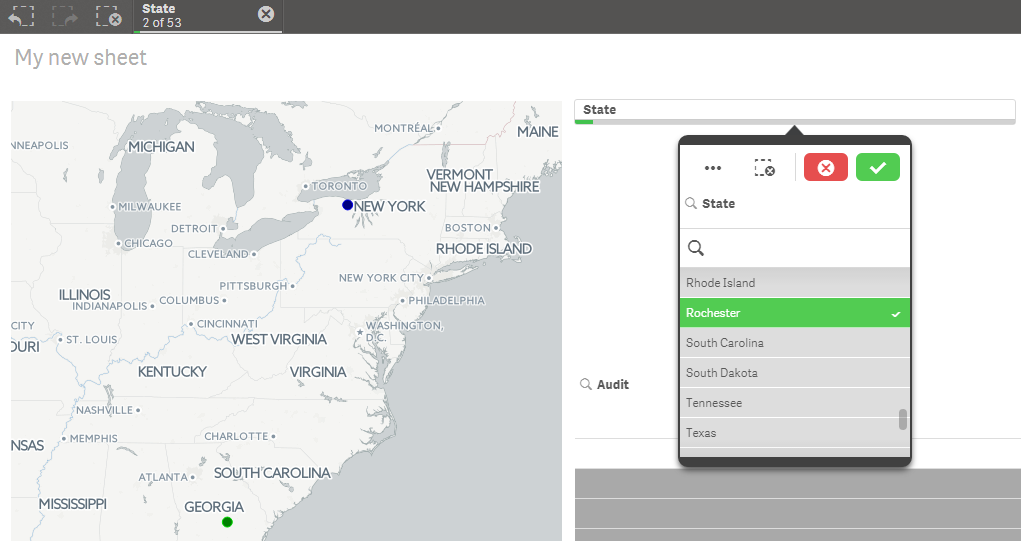
I am using the free qlik cloud version for creating map but for some of the location the bubble is not showing in the right location as for example Rochester, NY and also Greenville, SC.
Also how do I change the color for the particular bubble.
Thanks in advance.
- « Previous Replies
- Next Replies »
Accepted Solutions
- Mark as New
- Bookmark
- Subscribe
- Mute
- Subscribe to RSS Feed
- Permalink
- Report Inappropriate Content
May be make 2 new columns
Latitude
Longitude
And use the Latitude without ° N
And same for Longitude, without ° W. Instead of ° W use - for Longitude.
As below Image.
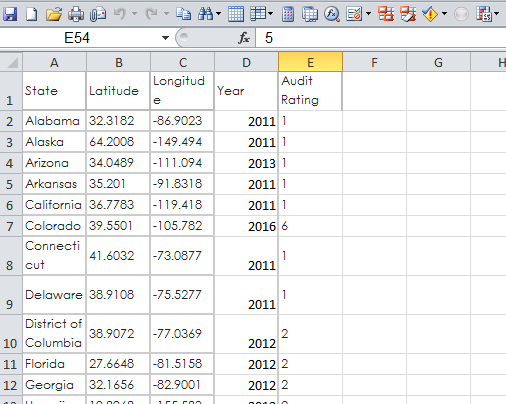
Example: Rochester, NY : 43.1610, -77.6109
If it a local file it won't be much of a problem to change/hardcode the values.
After you have Latitude & Longitude loaded
Use the following syntax in script....
Ex script:
LOAD
1.Region,
2.Site Location - Country,
3. Site Location - City,
Latitude,
Longitude,
GeoMakePoint(Latitude,Longitude) as GeoKey
GeoMakePoint(Latitude,Longitude) as GeoKey <<<
Use GeoKey as Point Layer in your Map as Dimension.
Thanks.
- Mark as New
- Bookmark
- Subscribe
- Mute
- Subscribe to RSS Feed
- Permalink
- Report Inappropriate Content
If the bubble is not showing on map it means you have no data for those states.
For the color coding you can do it by >Properties>Colors and Legends>Color by Custom> By expression>
Enter your desired expression to get colors you want.
Can you share a sample date and what colors you trying to achieve with what fields?
Thanks.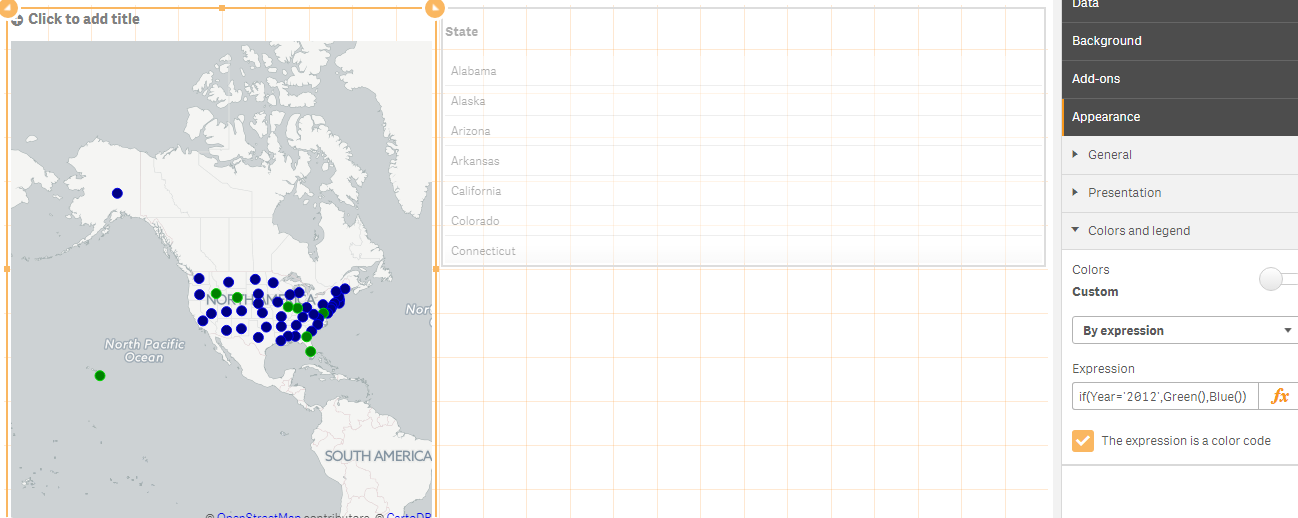
- Mark as New
- Bookmark
- Subscribe
- Mute
- Subscribe to RSS Feed
- Permalink
- Report Inappropriate Content
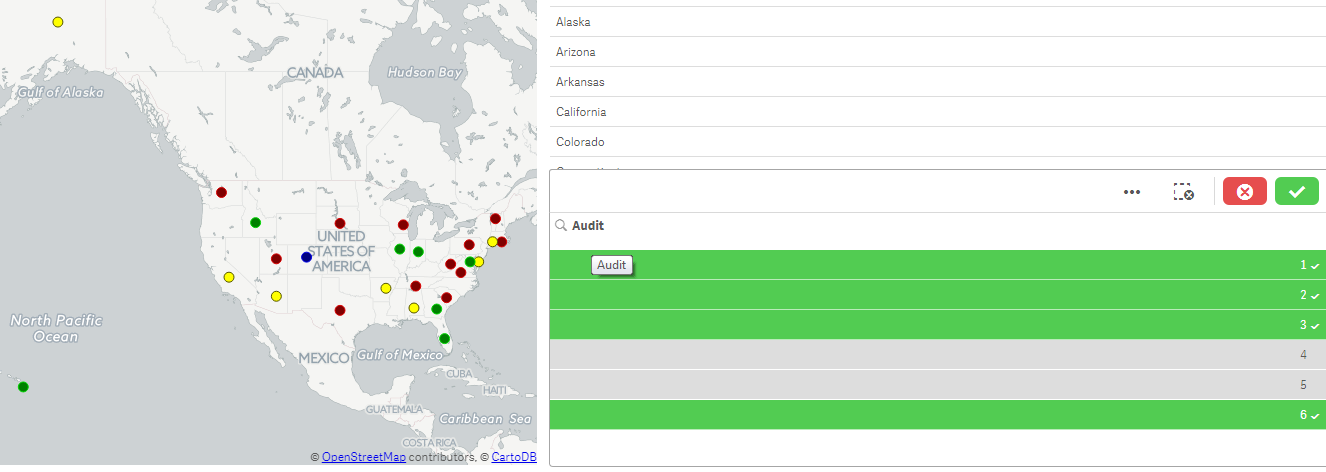
Currently the chart is being displayed like this using custom color the expression being used is sum(Audit rating) and dimension being the City. The bubble color needs to be according the audit rating just as 1 is Yellow, 2 is Green and 3 is Red.
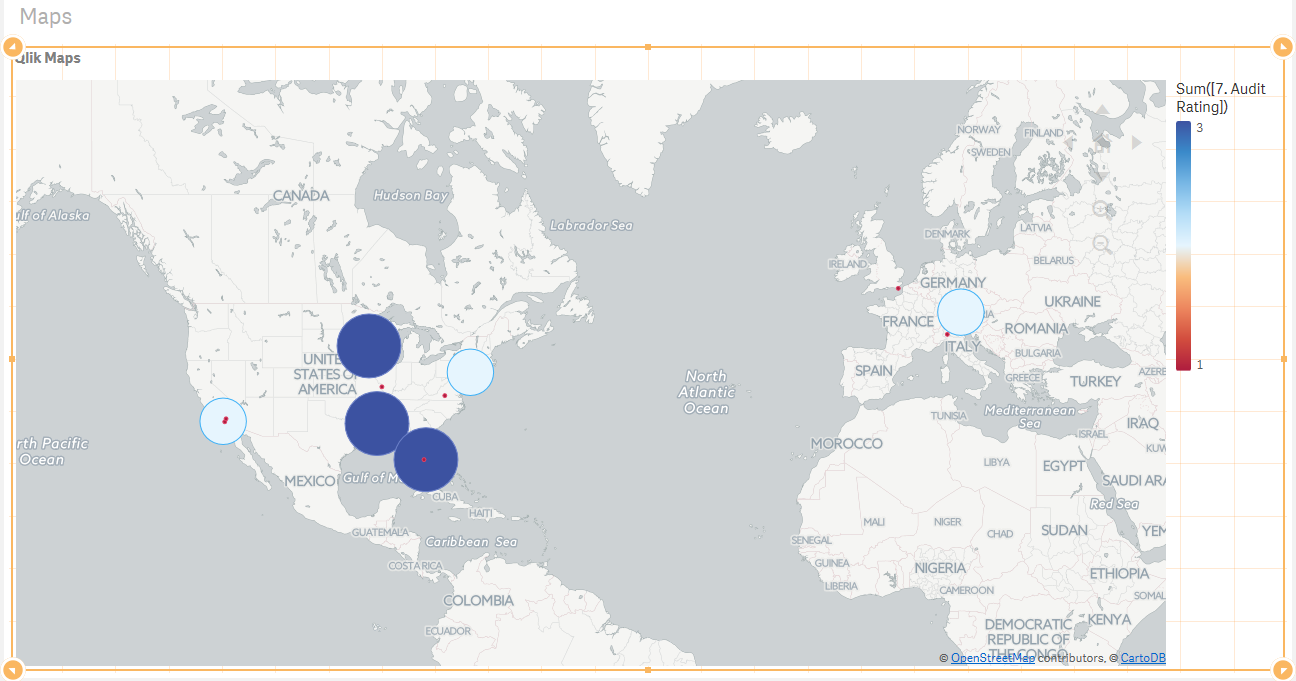
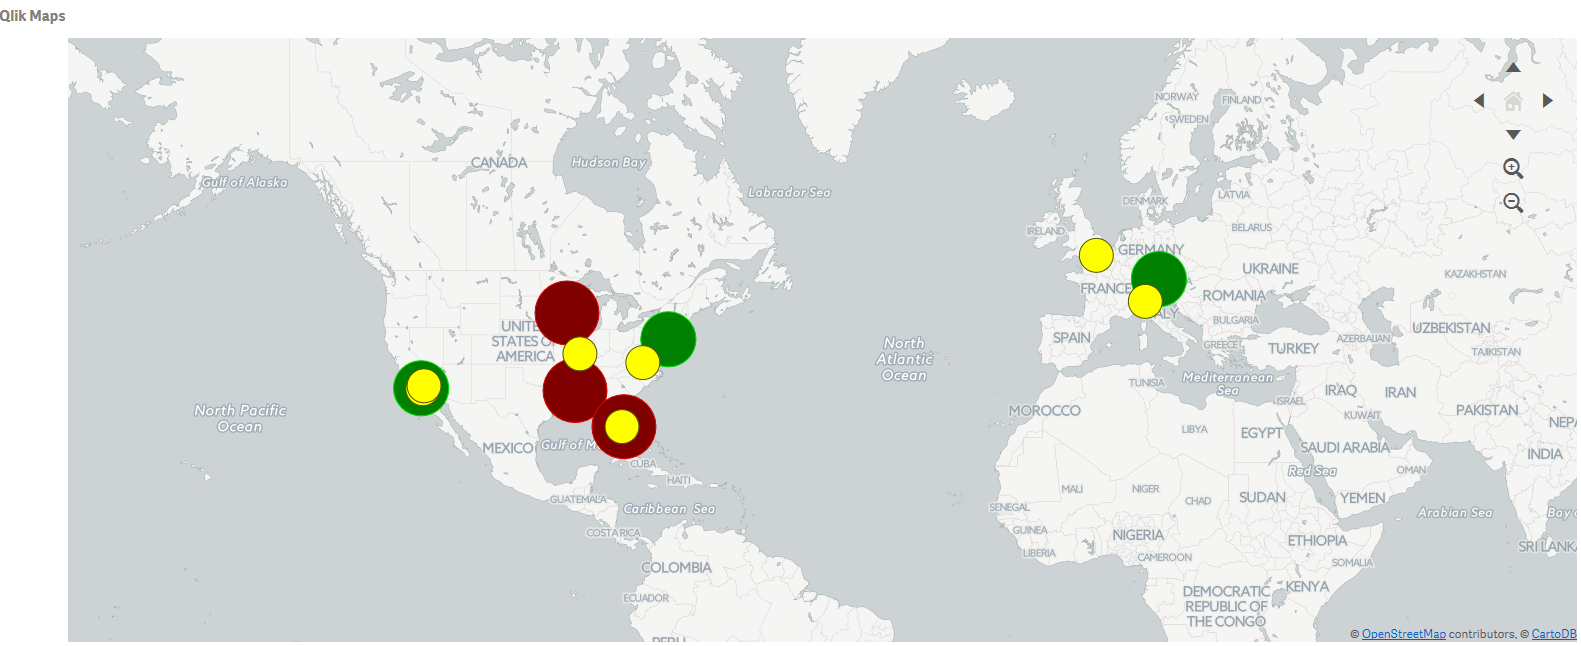
Further, if there are multiple data for lets suppose Greenville then the rating is being added I tried using just the Audit Rating as the expression but it is changing the size of the bubbles as below.
*I used the expression in the custom color in the expression section which is giving error.
=if(([7.Audit Rating])='1'], Yellow(),
if([7.Audit Rating]='2'], Green(),
if([7.Audit Rating]='3'], Red())))
- Mark as New
- Bookmark
- Subscribe
- Mute
- Subscribe to RSS Feed
- Permalink
- Report Inappropriate Content
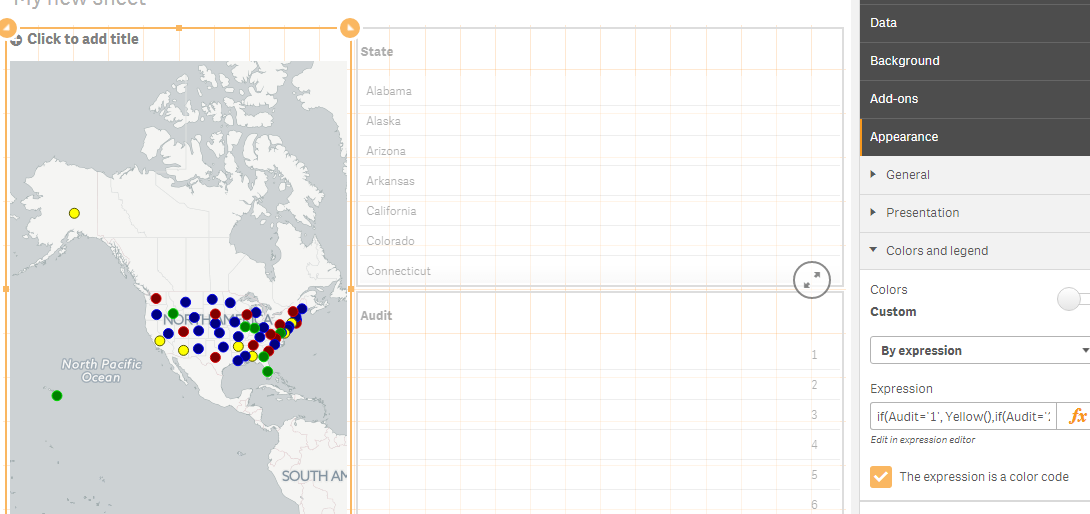
I used
if(Audit='1', Yellow(),
if(Audit='2', Green(),
if(Audit='3', Red(),
if(Audit>'3',Blue()))))
And to adjust the bubble size
Properties>Layers>Point Layer>Below you'll find bubble size slider
Adjust that slider to adjust the bubble size.
Maybe use this one
=if([7.Audit Rating])='1', Yellow(),
if[7.Audit Rating]='2', Green(),
if[7.Audit Rating]='3', Red())))
Try the above expression for your color code, check the ] which is not needed I guess, hence you getting error I suppose.
Note: Multiple states has same audit Number....
Like FL,IL,IN has audit number 2 and if you select those states it will only show Green. For your multiple data sets, if I understood it correctly.
- Mark as New
- Bookmark
- Subscribe
- Mute
- Subscribe to RSS Feed
- Permalink
- Report Inappropriate Content
Hi Shahbaz,
The color for the specific rating did work but for bubble size the bubble slider worked as well thanks for the suggestion. But for some reason some of the location for the bubble is not showing in the right location as for example Rochester, NY and also Greenville, SC.I am currently using the free cloud version of QlikSense.
Thanks so much.
- Mark as New
- Bookmark
- Subscribe
- Mute
- Subscribe to RSS Feed
- Permalink
- Report Inappropriate Content
I do not think there is any difference for a developer if he/she is using Qlik Sense Desktop or Cloud.
Cloud is used like an environment to host apps for other users but everything else is same, I've never used Cloud but Qlik Sense has no different function for Desktop or Cloud or Hub unless you trying to implement Section Access, which can be done only on Server. (developer point of view)
The bubbles not pointing on correct location might be cus of wrong Latitude and Longitude.
Check the Latitude and Longitude for Rochester, NY & Greenville, SC in your data and verify it with by searching on google.
Rochester, NY : 43.1610, -77.6109
Greenville, SC : 34.8526, -82.3940
Above are Lat & Long from Google search, verify it with your lat and long in data. If it is an XL file, change it. If it is coming from a source db then ask the concerned person to verify it.
Thanks.
- Mark as New
- Bookmark
- Subscribe
- Mute
- Subscribe to RSS Feed
- Permalink
- Report Inappropriate Content
Hi arvind654,
Thanks for your response. The latitude and longitude used is as below. I verified in google that is the lat and long for the specified location. I see that you have used - in the second coordinate do you that should make a difference. I see in the map for all other location the bubble is at a exact location except for the sited below which is confusing.
Rochester, NY :
| 43.1610° N, 77.6109° W |
Greenville, SC :
| 34.8526° N, 82.3940° W |
- Mark as New
- Bookmark
- Subscribe
- Mute
- Subscribe to RSS Feed
- Permalink
- Report Inappropriate Content
The reason I use - is because qlik sense will not read N or W
So if it is a Longitude we give it as - in data.
Can you provide me sample of your state, lat & Long data xl file?
I can check it for you.
Or at least post a screen shot of the latitude & Longitude from your data
Thanks.
- Mark as New
- Bookmark
- Subscribe
- Mute
- Subscribe to RSS Feed
- Permalink
- Report Inappropriate Content
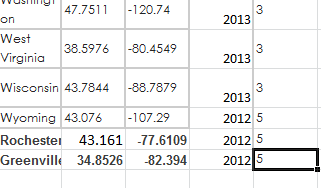
Below I added those two Lat & Long in my local XL file to verify the data point position and it is showing me as it should be.
Rochester in NY and Greenville in SC.
Please check your latitude and longitude in data file or source.
- Mark as New
- Bookmark
- Subscribe
- Mute
- Subscribe to RSS Feed
- Permalink
- Report Inappropriate Content
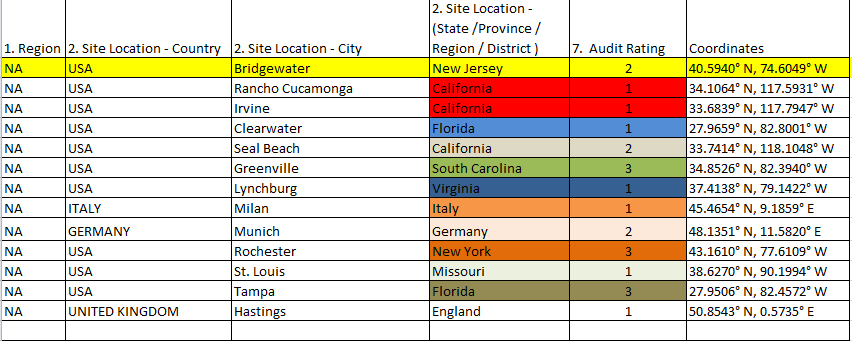
Hi,
Below is the lat and long file being used. I am not being able to attach the file itself. Please advice what changes should I make to view correct position for Rochester and Greenville how to come up with a correct position as other are coming up correct.
- « Previous Replies
- Next Replies »