Unlock a world of possibilities! Login now and discover the exclusive benefits awaiting you.
- Qlik Community
- :
- Forums
- :
- Analytics
- :
- New to Qlik Analytics
- :
- Max YearMonth
- Subscribe to RSS Feed
- Mark Topic as New
- Mark Topic as Read
- Float this Topic for Current User
- Bookmark
- Subscribe
- Mute
- Printer Friendly Page
- Mark as New
- Bookmark
- Subscribe
- Mute
- Subscribe to RSS Feed
- Permalink
- Report Inappropriate Content
Max YearMonth
Hello,
I want to Show last max month on line chart. but to have different Lines for three years.
for dimension I use this:
Dual(Date(date,'MMM D'),DayNumberOfYear(date)) AS YearDayNo
and as meaasure This:
sum({$<Year = {$(=max(Year))}, Month = {$(=max(Month))}>} FactSoldAmount)
but it doesn't show me anything.
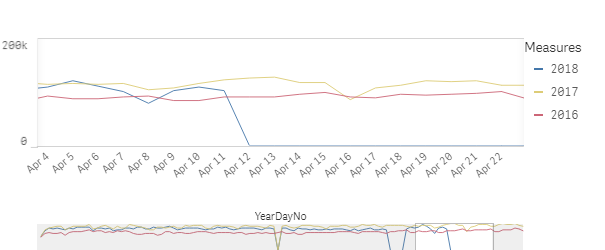
can you Please tell me how can I show This different Three lines on chart for max month.
I want something like this but only last Month
- Mark as New
- Bookmark
- Subscribe
- Mute
- Subscribe to RSS Feed
- Permalink
- Report Inappropriate Content
if your Month is not a number value, change to:
sum({$<Year = {$(=max(Year))}, Month = {$(=Month(max(Month)))}>} FactSoldAmount)
Set expressions tend not to honor the duality of a date field and will return the number when a numeric function is used.