Unlock a world of possibilities! Login now and discover the exclusive benefits awaiting you.
- Qlik Community
- :
- Forums
- :
- Analytics
- :
- New to Qlik Analytics
- :
- Max and Min values of Y-axis change with alternati...
- Subscribe to RSS Feed
- Mark Topic as New
- Mark Topic as Read
- Float this Topic for Current User
- Bookmark
- Subscribe
- Mute
- Printer Friendly Page
- Mark as New
- Bookmark
- Subscribe
- Mute
- Subscribe to RSS Feed
- Permalink
- Report Inappropriate Content
Max and Min values of Y-axis change with alternative measures (Qlik Sense)
Dear all,
I have a bar chart with one dimension and two measures (one of them is alternative). Is it possible to change dinamically the maximum and minimum values of Y-axis when displaying one measure or the other one. For example, when displaying measure1 values of y-axis should range from -200 to 100 and range from -100 to 300 when displaying measure2.
Is it possible to achieve it?
Thank you very much in advance.
Best regards,
Gonzalo
- Mark as New
- Bookmark
- Subscribe
- Mute
- Subscribe to RSS Feed
- Permalink
- Report Inappropriate Content
I know how to set máximum and mínimum values of y-axis if I didn't have alternative measures.
- Mark as New
- Bookmark
- Subscribe
- Mute
- Subscribe to RSS Feed
- Permalink
- Report Inappropriate Content
you don't use alternative measures to do this, but instead create an inline table as follow:
load * inline [
MeasureID, Measure
1, YourFirstMeasure
2, YourSecondMeasure
];
now, add this new Measure filed as a fitter in ur dashboard;
in ur chart, as measure:
if(MeasureID=1, sum(Measure1), sum(Measure2)) , with that, if u select from ur filter, YourFirstMeasure, u'll have sum(Measure1) etc..
same approach to build the min and max values with if conditions
example:
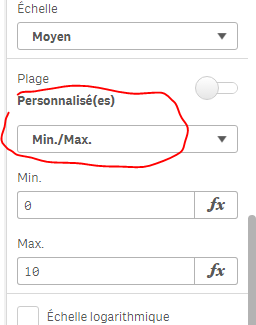
for min:
if (MeasureID=1,-200,0)
max:
if(MeasureID=1,500,2000)
and u can always make ur chart clearer; by adding a condition in ur adds on, count(distinct MeasureID)=1
with that, u force a selection of one measure only !
and add this information in your chart title, for example
=Measure&' by year'
with that, u'll know, what measure u're using in the chart..
and maybe same approach in the expression label
hope that was clear..