Unlock a world of possibilities! Login now and discover the exclusive benefits awaiting you.
- Qlik Community
- :
- Forums
- :
- Analytics
- :
- New to Qlik Analytics
- :
- Measure independent of dimension
- Subscribe to RSS Feed
- Mark Topic as New
- Mark Topic as Read
- Float this Topic for Current User
- Bookmark
- Subscribe
- Mute
- Printer Friendly Page
- Mark as New
- Bookmark
- Subscribe
- Mute
- Subscribe to RSS Feed
- Permalink
- Report Inappropriate Content
Measure independent of dimension
Hello All,
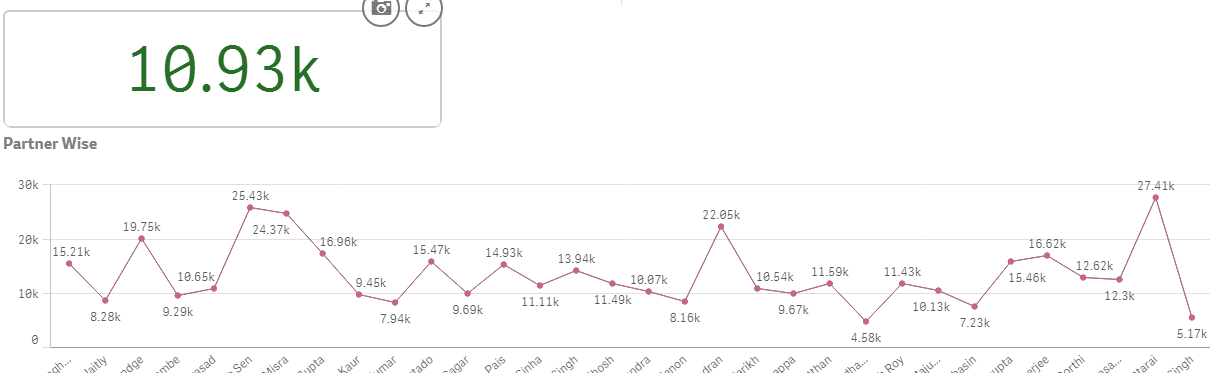
I am using Qlik Sense, Can you suggest as to how I can write a measure which is just independent of one measure. I have attached a sample snip which shows that my average of the KPI is 10.93k. I want this to show up as a goal line in the graph below. Help me achieve that please.
Thanks in advance.
Accepted Solutions
- Mark as New
- Bookmark
- Subscribe
- Mute
- Subscribe to RSS Feed
- Permalink
- Report Inappropriate Content
Hi Siddharth,
In Graph Properties --> Add-ons tab, there is an option for Reference Line.
In the expression of the reference line, add expression as Avg(KPI).
This will bring up a reference line (goal line in your case) in the graph.
Hope this is what you are looking for.
Regards,
Rohan
- Mark as New
- Bookmark
- Subscribe
- Mute
- Subscribe to RSS Feed
- Permalink
- Report Inappropriate Content
Figured it out soon after I posted it. Thanks.