Unlock a world of possibilities! Login now and discover the exclusive benefits awaiting you.
- Qlik Community
- :
- Forums
- :
- Analytics
- :
- New to Qlik Analytics
- :
- Re: Measuring difference between Max week and prev...
- Subscribe to RSS Feed
- Mark Topic as New
- Mark Topic as Read
- Float this Topic for Current User
- Bookmark
- Subscribe
- Mute
- Printer Friendly Page
- Mark as New
- Bookmark
- Subscribe
- Mute
- Subscribe to RSS Feed
- Permalink
- Report Inappropriate Content
Measuring difference between Max week and previous in a KPI Widget
Hi All,
I want to use a KPI widget to show Numbers of Incidents for the Max week, Then add an up down arrow or conditional limit to show how this changed from the week previously.
I have tried to add a master calendar and from posts ive read I think that I need use use (Max(Date) and (Max(Date)-1) but haven't had any luck.
Examples of the kind of expressions ive tried are below
//Count(Incident)
//Count( {$<Year = {$(#varMaxDate)}>} Incident )
//=Count({<Month={$(=Max(Month)-1)}>} Incident )
//Count({<Month={$(=Max(Month)-1)}>} Incident)
//Count({<MonthName={"$(=Month(Max(Date)-1))"},Year={"$(=(Year))"}>}Incident)
//Count({$<MonthYear={$(=Only(MonthYear)-1)}>}Incident)
//Count({<Month = {$(MONTH =(MAX(Date))}>} Incident
//Count({<Year = {$(MAX(Year))},Month = {'$(=MONTH(MAX(Date)))'}>}Incident)
Any help would be much appreciated.
QVF attached
Thanks
Josh
- « Previous Replies
-
- 1
- 2
- Next Replies »
Accepted Solutions
- Mark as New
- Bookmark
- Subscribe
- Mute
- Subscribe to RSS Feed
- Permalink
- Report Inappropriate Content
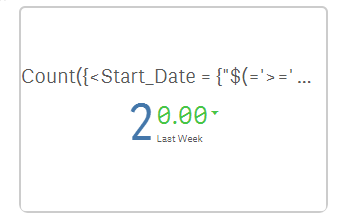
May be try this expression for Previous Period
If(GetSelectedCount(Week) > 0,
Count({<Start_Date = {"$(='>=' & Date(WeekStart(Max(Start_Date), -1)) & '<=' & Date(WeekEnd(Max(Start_Date), -1)))"}, Week, Month>}Incident),
If(GetSelectedCount(Month) > 0,
Count({<Start_Date = {"$(='>=' & Date(MonthStart(Max(Start_Date), -1)) & '<=' & Date(MonthEnd(Max(Start_Date), -1)))"}, Week, Month>}Incident)))
I am not sure if colors and directions or error are right or not. If the incidents went down from previous period the previous period number will be in green with down arrow?
I am sure you will be able to fix the colors.
HTH
Best,
Sunny
- Mark as New
- Bookmark
- Subscribe
- Mute
- Subscribe to RSS Feed
- Permalink
- Report Inappropriate Content
There are multiple sheets in your application, which one are we checking out? What is the expected output?
- Mark as New
- Bookmark
- Subscribe
- Mute
- Subscribe to RSS Feed
- Permalink
- Report Inappropriate Content
Hi Sunny,
Thanks for getting back to me.
The sheet in question is
The expected outcome is to have the 'Incidents' KPI widget display the most recent month or week and then use either conditional formatting to show a RAG status against the previous week/month OR use a the widgets subset to display the difference between the previous week/month with up/ down arrows.
Attached a screenshot and the Data as well if that helps
- Mark as New
- Bookmark
- Subscribe
- Mute
- Subscribe to RSS Feed
- Permalink
- Report Inappropriate Content
There are two dates in your Excel file, are you looking for incidents based of Max(Start_Date) and Max(Start_Date) - 1 or Close Date? and once again from the Excel sample you have shared what do you expect those counts to be?
- Mark as New
- Bookmark
- Subscribe
- Mute
- Subscribe to RSS Feed
- Permalink
- Report Inappropriate Content
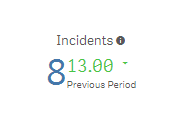
It would be Max(Start_Date) and Max(Start_Date) - 1. In week 35 there were' 2' incidents and in week 34 '0' so i expect the KPI widget to show '2' and the subset to display '+2' in red to show there there were 2 more incidents than the previous week.
A similar view for month.
Is there a way I can show -1 period. So that if I filter on a week it will show the difference from the previous week and if I filter on a month it would show the previous month?
Josh
- Mark as New
- Bookmark
- Subscribe
- Mute
- Subscribe to RSS Feed
- Permalink
- Report Inappropriate Content
Hi Sunny.
I wondered if you had anymore thoughts on this? Is there somthing missing that I havent provided?
Josh
- Mark as New
- Bookmark
- Subscribe
- Mute
- Subscribe to RSS Feed
- Permalink
- Report Inappropriate Content
Hey Josh -
Totally skipped my mind, will get back to this today for sure 
- Mark as New
- Bookmark
- Subscribe
- Mute
- Subscribe to RSS Feed
- Permalink
- Report Inappropriate Content
Thanks Sunny! It would be good to hear on this. Josh
- Mark as New
- Bookmark
- Subscribe
- Mute
- Subscribe to RSS Feed
- Permalink
- Report Inappropriate Content
May be try these two expressions:
1) This week
Count({<Start_Date = {"$(='>=' & Date(WeekStart(Max(Start_Date))) & '<=' & Date(Max(Start_Date)))"}>}Incident)
2) Last Week
Count({<Start_Date = {"$(='>=' & Date(WeekStart(Max(Start_Date), -1)) & '<=' & Date(WeekEnd(Max(Start_Date), -1)))"}>}Incident)
- Mark as New
- Bookmark
- Subscribe
- Mute
- Subscribe to RSS Feed
- Permalink
- Report Inappropriate Content
Hi Sunny.
Thanks for your help so far.
Unfortunately I dont think the above expressions solve my need.
I think I should clarify a bit more of what I need as I dont think I was specific enough. Overall the business need is that incidents for a selected period should be instantly visible and view of how this compares to the previous period should be present.
When a period is selected such as week or month I want my main KPI body to display the count of incidents. e.g. This can be achieved using the simple expression " Count (Incident) "
For instance on Week 35 there were two incidents, so my KPI widget will display "2"
(Equally for the Month of August there were "7" incidents so my KPI widget will represent this)
In the subset of my KPI widget I want to show the previous weeks or months view and the difference between current vs previous periods.
For example in Week 34 there were three incidents so whilst my core KPI widget will show "2" my subset should show "-1"
(Equally for the Month of July there were only "5" incidents so when August is filtered my KPI subset should show "-2")
If the number is negative I want this to be represented as Green and there are less incidents than the previous period, if it is positive this number should be red as there are now more incidents than the previous period.
I need my widgets to be responsive based on the time-frame selected and to show data for the selected period in the main body of the KPI and the change based on the previous period in the subset.
I hope this clarifies things.
Hope you can help
Josh
(Attached are the latest versions of my QVF and data set)
- « Previous Replies
-
- 1
- 2
- Next Replies »