Unlock a world of possibilities! Login now and discover the exclusive benefits awaiting you.
- Qlik Community
- :
- Forums
- :
- Analytics
- :
- New to Qlik Analytics
- :
- Re: Merge Date Dimensions
- Subscribe to RSS Feed
- Mark Topic as New
- Mark Topic as Read
- Float this Topic for Current User
- Bookmark
- Subscribe
- Mute
- Printer Friendly Page
- Mark as New
- Bookmark
- Subscribe
- Mute
- Subscribe to RSS Feed
- Permalink
- Report Inappropriate Content
Merge Date Dimensions
Hi guys.
I have a table that stores employees informations. Two of those of these informations are Demission and Admission date.
I want to create e chart bar report that shows per month the count of demissions and admissions (turn over analysis) and I can't figure out how I can do that.
The first thing I though was to create a load script like the one I post below. But I think it's not a good solution, since it would be a useless table and I would use it only for a chart.
Is there a way to merge those two fields into one and flag them as "admission" ou "demission" just for a chart bar report? Maybe with AGGR function?
I've searched a lot in forum but I couldn't get a answer.
/*Example Script*/
[UselessTable]:
LOAD
DemissionField as Date,
'Demission' as Type
FROM [lib://RH/Dim_Employee.qvd]
(qvd);
LOAD
AdmissionField as Date,
'Admission' as Type
FROM [lib://RH/Dim_Employee.qvd]
(qvd);
Thanks all in advance
- Tags:
- merge dimension
- « Previous Replies
-
- 1
- 2
- Next Replies »
Accepted Solutions
- Mark as New
- Bookmark
- Subscribe
- Mute
- Subscribe to RSS Feed
- Permalink
- Report Inappropriate Content
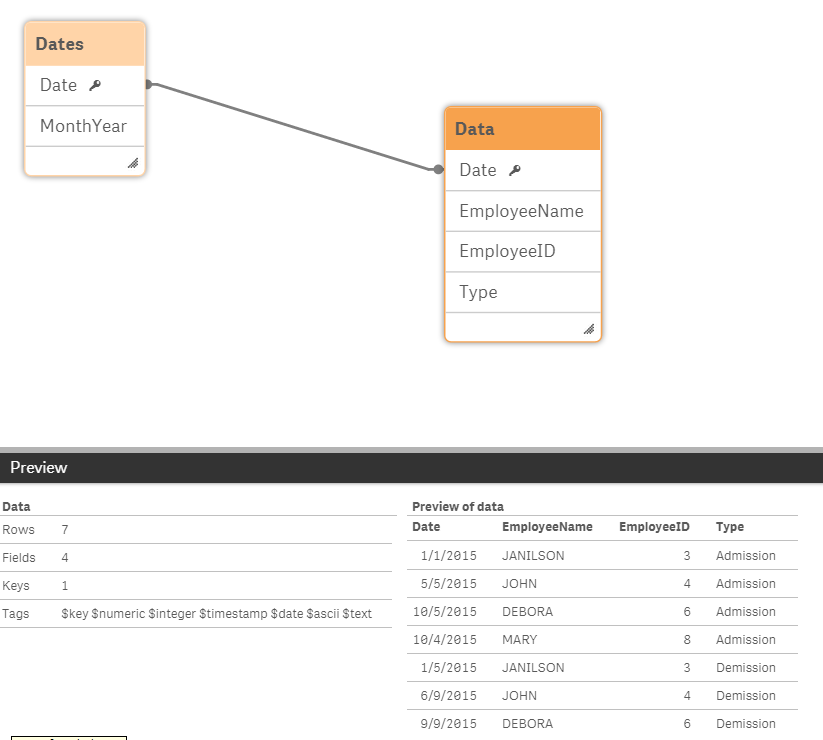
Here is a load script that reads the above table in 2 passes to replace the 2 dates with one 'Date' field and a new 'Type' field which has Admission/Demission as the values.
The data above had a blank for the demission date for employee 8. Your actual data source may have nulls in which case you would have to change the where clause below using the isnull() function to check for nulls.
Finally , i bucketed all the dates into a MonthYear field which you seem to want
Data:
Load
EmployeeName,
EmployeeID,
date("Admission Date") as Date,
'Admission' as Type
FROM [lib://184795]
where not "Admission Date"='';
Load
EmployeeName,
EmployeeID,
date("Demission Date") as Date,
'Demission' as Type
FROM [lib://184795]
where not "Demission Date"='' ;
drop table temp;
Dates:
Load
Date,
MonthName(Date) as MonthYear
resident Data;
- Mark as New
- Bookmark
- Subscribe
- Mute
- Subscribe to RSS Feed
- Permalink
- Report Inappropriate Content
What you need to work with is a master calendar to link your 2 dates under one centralised date control.
This link should contain resources to get you started.
Understanding the Master Calendar (video)
There are more if you search for it.
Hope this helps
Andy
- Mark as New
- Bookmark
- Subscribe
- Mute
- Subscribe to RSS Feed
- Permalink
- Report Inappropriate Content
That structure you have would work for your case and future use if you add 1 AS ID to it.
Then do something like
Measure = SUM([ID])
Dimension = Type, Date
In a bar chart
- Mark as New
- Bookmark
- Subscribe
- Mute
- Subscribe to RSS Feed
- Permalink
- Report Inappropriate Content
You are right, I should use 1 as ID in order to load the table twice (to get two date types).
I don't understand quite well how a Master Calender would help me (I will watch this video to see if it helps me).
I'm totally lost on it.
- Mark as New
- Bookmark
- Subscribe
- Mute
- Subscribe to RSS Feed
- Permalink
- Report Inappropriate Content
The way my data is, I can only have a bar chart with Admission date or Demission date (per month), but not both. Like image below
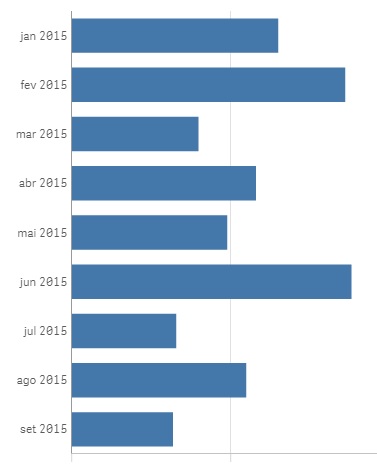
I want to have 2 bars per month.
- Mark as New
- Bookmark
- Subscribe
- Mute
- Subscribe to RSS Feed
- Permalink
- Report Inappropriate Content
If you have your data structured as above have you tried using set analysis on your measures
something like
Dimension= Date
Measure 1 = # Of Admissions: SUM({<Type={'Admission'}>} ID)
Measure 2 = # Of Deadmissions: SUM({<Type={'Demission'}>} ID)
- Mark as New
- Bookmark
- Subscribe
- Mute
- Subscribe to RSS Feed
- Permalink
- Report Inappropriate Content
The problem is that I don't have this structure.
Let me show you a sample of my table:
| EmployeeName | EmployeeID | Admission Date | Demission Date |
|---|---|---|---|
| JANILSON | 3 | 01/01/2015 | 01/05/2015 |
| JOHN | 4 | 05/05/2015 | 06/09/2015 |
| DEBORA | 6 | 10/05/2015 | 09/09/2015 |
| MARY | 8 | 10/04/2015 |
My table is more or less like the one above. I have two date dimensions. I want to know the number of admission x demission per month. In order to do that, without creating a new table, I must turn those two fields into one.
- Mark as New
- Bookmark
- Subscribe
- Mute
- Subscribe to RSS Feed
- Permalink
- Report Inappropriate Content
Here is a load script that reads the above table in 2 passes to replace the 2 dates with one 'Date' field and a new 'Type' field which has Admission/Demission as the values.
The data above had a blank for the demission date for employee 8. Your actual data source may have nulls in which case you would have to change the where clause below using the isnull() function to check for nulls.
Finally , i bucketed all the dates into a MonthYear field which you seem to want
Data:
Load
EmployeeName,
EmployeeID,
date("Admission Date") as Date,
'Admission' as Type
FROM [lib://184795]
where not "Admission Date"='';
Load
EmployeeName,
EmployeeID,
date("Demission Date") as Date,
'Demission' as Type
FROM [lib://184795]
where not "Demission Date"='' ;
drop table temp;
Dates:
Load
Date,
MonthName(Date) as MonthYear
resident Data;
- Mark as New
- Bookmark
- Subscribe
- Mute
- Subscribe to RSS Feed
- Permalink
- Report Inappropriate Content
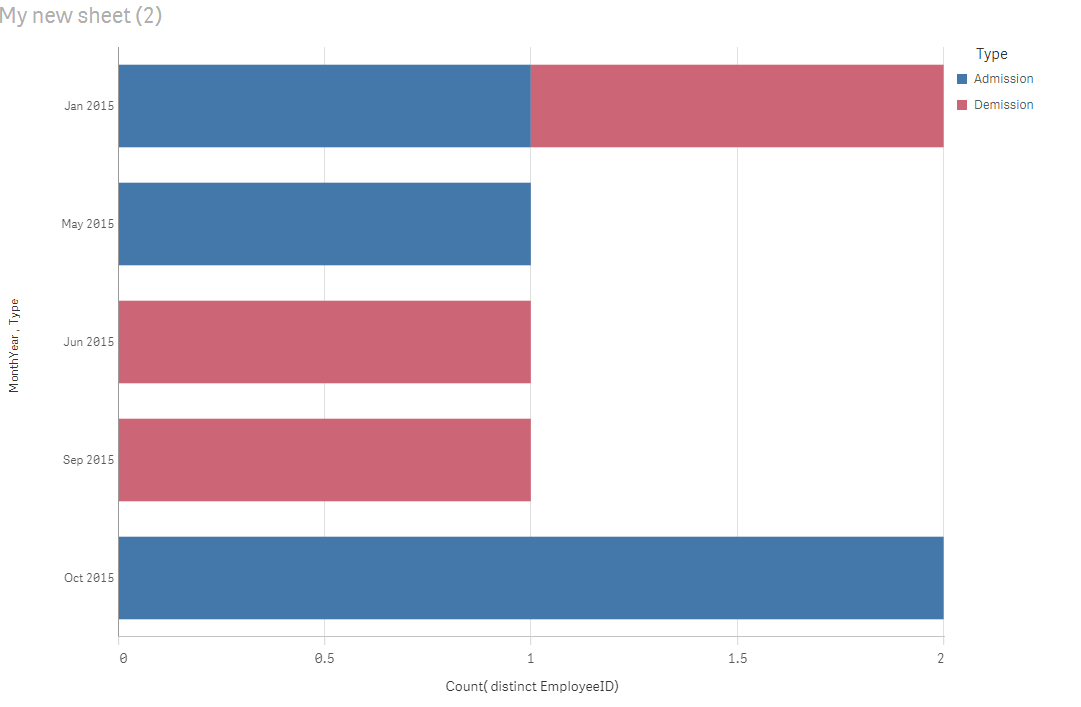
And forgot... the measure and dimensions in the chart are
Dimension1: MonthYear
Dimension2: Type
Measure: count(distinct EmployeeID)
- Mark as New
- Bookmark
- Subscribe
- Mute
- Subscribe to RSS Feed
- Permalink
- Report Inappropriate Content
I thought about his solution, but I thought it would be a waste of space since I'll duplicate the rows in my table. But, I will use it, maybe it's the only way to do what I want.
Thanks a lot @Jonathan Pole and @Andy Weir for your replies.
Thanks community
- « Previous Replies
-
- 1
- 2
- Next Replies »