Unlock a world of possibilities! Login now and discover the exclusive benefits awaiting you.
- Qlik Community
- :
- Forums
- :
- Analytics
- :
- New to Qlik Analytics
- :
- Missing Dimension values
- Subscribe to RSS Feed
- Mark Topic as New
- Mark Topic as Read
- Float this Topic for Current User
- Bookmark
- Subscribe
- Mute
- Printer Friendly Page
- Mark as New
- Bookmark
- Subscribe
- Mute
- Subscribe to RSS Feed
- Permalink
- Report Inappropriate Content
Missing Dimension values
Hi Experts,
I have data like below:
| ID | Grade | Score |
| 1 | 1 | 273 |
| 2 | 1 | 275 |
| 3 | 1 | 279 |
| 4 | 1 | 311 |
| 5 | 1 | 325 |
| 6 | 1 | 330 |
| 7 | 1 | 332 |
| 8 | 1 | 333 |
| 9 | 1 | 345 |
| 10 | 1 | 346 |
| 11 | 1 | 347 |
| 12 | 1 | 348 |
| 13 | 1 | 349 |
| Grade | Low | High |
| 1 | 250 | 360 |
| 2 | 265 | 400 |
As the qvf file attached, I can build a bar chart,
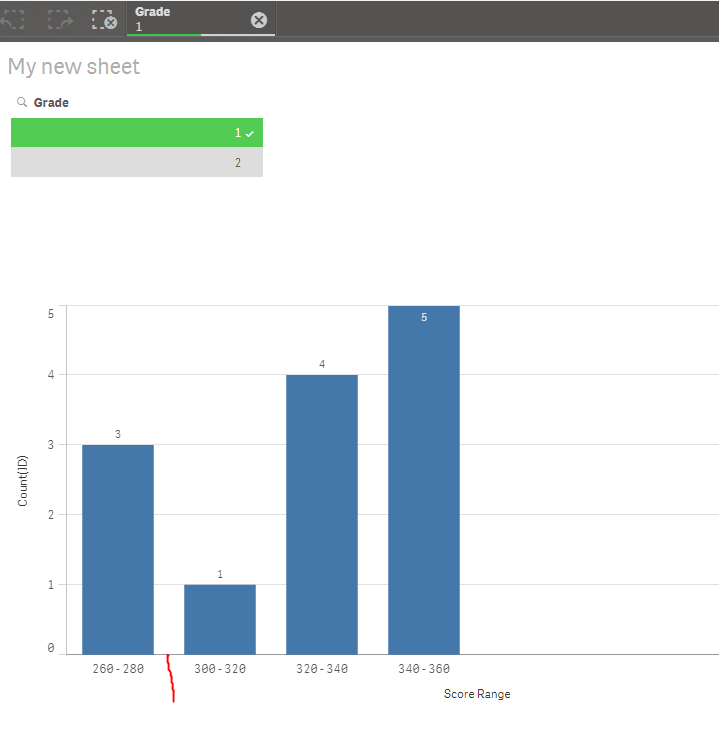
However, there are two things I want to have here:
1. I don't want to miss any score range even it is 0 count, such as 280-300
2. I need the all the score ranges from Low to High(Data should read from LowHigh table at run time) with interval 20 in my bar chart:
| Score Range | IDCount |
| 250-269 | 0 |
| 270-289 | 3 |
| 290-309 | 0 |
| 310-329 | 2 |
| 330-349 | 8 |
| 350-360 | 0 |
How can I achieve these?
Thanks for you help in advance!
Jing
- « Previous Replies
-
- 1
- 2
- Next Replies »
- Mark as New
- Bookmark
- Subscribe
- Mute
- Subscribe to RSS Feed
- Permalink
- Report Inappropriate Content
Thank you very much swuehl! This is exactly what I am looking for and I applied in my more complicated actual data successfully.
Just one more question, in this case, how can I solve the synthetic key issue? I do need grade, content as my selection list at presentation. and I need based on the selection to get other data at run time.
Regards,
Jing
- Mark as New
- Bookmark
- Subscribe
- Mute
- Subscribe to RSS Feed
- Permalink
- Report Inappropriate Content
What's the exact issue with the synthetic key? Don't you get all data at run time?
In this scenario, I think the synthetic key is not a bad thing, since you also want to show the full range of buckets on the x-axis.
You can try creating a combined key made of Content, Grade and Bucket, but you may run into other issues regarding your full range display.
- Mark as New
- Bookmark
- Subscribe
- Mute
- Subscribe to RSS Feed
- Permalink
- Report Inappropriate Content
swuehl, there is no issue for this solution so far, and I got what I want at run time. I thought we'd better to avoid the synthetic key, but in this case, I guess I have to keep it as-is. Thanks!
- « Previous Replies
-
- 1
- 2
- Next Replies »