Unlock a world of possibilities! Login now and discover the exclusive benefits awaiting you.
- Qlik Community
- :
- Forums
- :
- Analytics
- :
- New to Qlik Analytics
- :
- Re: Modify legend in map
- Subscribe to RSS Feed
- Mark Topic as New
- Mark Topic as Read
- Float this Topic for Current User
- Bookmark
- Subscribe
- Mute
- Printer Friendly Page
- Mark as New
- Bookmark
- Subscribe
- Mute
- Subscribe to RSS Feed
- Permalink
- Report Inappropriate Content
Modify legend in map
Hello, I'm having trouble to fit the map chart and the legend as I want :
- I want the legend to take as much space as possible to have the title completely visible. Actually, I can't have a title that has more than 2 words without being hidden.
- I want to modify the legend range or the classes with a formula (i.e. to show numbers in french format, to show the square of the numbers (because my formula gives the square root of the quantity to have better differences, to set the classes and not have the 3 default ones).
- I want to set the default zoom to be on Metropolitan France and not to include all possible values, and to return to Metropolitan France when I click on the Home button.
Are those things possible and how I can do it ?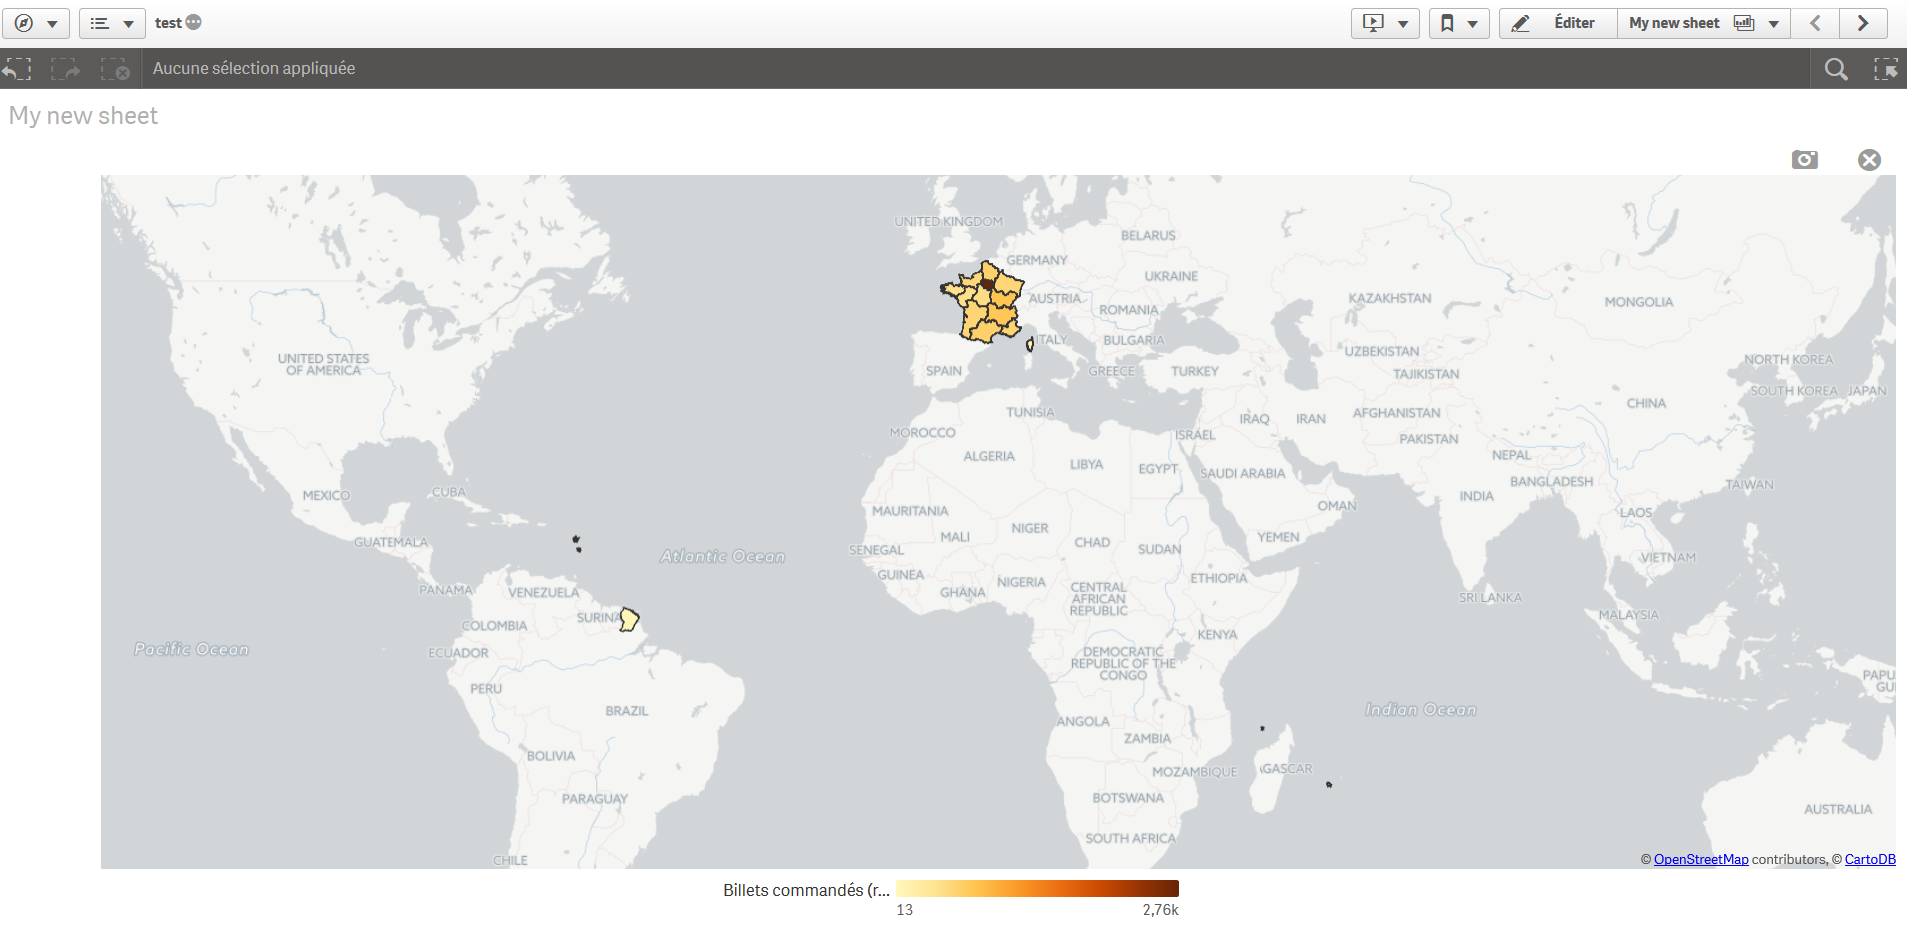
- Mark as New
- Bookmark
- Subscribe
- Mute
- Subscribe to RSS Feed
- Permalink
- Report Inappropriate Content
Try Sequential Class or Divergent Class as legend color. that would break down your values into different numbers. Hence occupying the area.
I don't understand your 2nd request.
For zoom, you cannot set a default view in this map. You are seeing full view as there is a data point in South America as well. I don't think that can be changed.
- Mark as New
- Bookmark
- Subscribe
- Mute
- Subscribe to RSS Feed
- Permalink
- Report Inappropriate Content
Hello, thank you for your answer but it doesn't solve my problem :
- I tried your first solution but my legend is still shrank, I can't have it fully displayed.
- I meant I want to change the format of my numbers in the legend.
- Ok thank you
- Mark as New
- Bookmark
- Subscribe
- Mute
- Subscribe to RSS Feed
- Permalink
- Report Inappropriate Content
To change number format you will have to change it at measure Section where you have added expression.
According to that number format will change in legend.
Also change place of legend from Color and Legend section and place it to Right of Left.
- Mark as New
- Bookmark
- Subscribe
- Mute
- Subscribe to RSS Feed
- Permalink
- Report Inappropriate Content
Changing the place doesn't fix the problem but thank you for your answers