Unlock a world of possibilities! Login now and discover the exclusive benefits awaiting you.
- Qlik Community
- :
- Forums
- :
- Analytics
- :
- New to Qlik Analytics
- :
- Multi row total on top of a table in Qlik Sense
- Subscribe to RSS Feed
- Mark Topic as New
- Mark Topic as Read
- Float this Topic for Current User
- Bookmark
- Subscribe
- Mute
- Printer Friendly Page
- Mark as New
- Bookmark
- Subscribe
- Mute
- Subscribe to RSS Feed
- Permalink
- Report Inappropriate Content
Multi row total on top of a table in Qlik Sense
Hi All,
I have a requirement where there are 3 dimensions and 8 measures to be shown in a table.
I have used a Qlik table to display the data. Here the Total is being shown on the top row i.e total for all the measures under the measure column.
But the Business wants to see 4 rows of total one below the other. These totals should be displayed before the data field starts.
Example
| Header 1 | Header 2 |
|---|---|
Name | Revenue |
Total East Rev Total West Rev Total South Rev Total North Rev | 1000$ 2000$ 3000$ 4000$ |
| Scholes | 500$ |
| Beckham | 800$ |
I am not able to do this in normal Qlik table. But was wondering if this could be achieved by using a Vizlib table.
Any help would be highly appreciable.
- Mark as New
- Bookmark
- Subscribe
- Mute
- Subscribe to RSS Feed
- Permalink
- Report Inappropriate Content
Hi,
maybe it's not far from what you want :
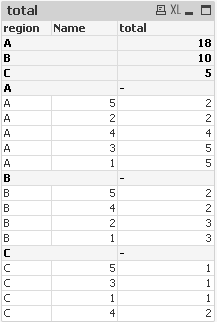
in dimension use : valueloop(1,2) , Region, Name
and in expression :
if( (valueloop(1,2)=2 and dimensionality()=3)
or (valueloop(1,2)=1 and dimensionality()=2),sum(revenue))
hide dimension valueloop(), and add subtotal for dimension name
look like this :
regards
- Mark as New
- Bookmark
- Subscribe
- Mute
- Subscribe to RSS Feed
- Permalink
- Report Inappropriate Content
Hi Amijit,
This could be achieved using the recently released vizlib pivot table, when you dynamic border control of cells.
Check it out at www.vizlib.com/pivot
Alternatively, with the Vizlib Table, you can use dynamic css styling, so you could modify the css attributes for the border on a cell level (with the vizlib table it comes a bullet bar chart example that does something similar btw)
Cheers,
David