Unlock a world of possibilities! Login now and discover the exclusive benefits awaiting you.
- Qlik Community
- :
- Forums
- :
- Analytics
- :
- New to Qlik Analytics
- :
- Re: Multiple Dimension aggregation Columns
- Subscribe to RSS Feed
- Mark Topic as New
- Mark Topic as Read
- Float this Topic for Current User
- Bookmark
- Subscribe
- Mute
- Printer Friendly Page
- Mark as New
- Bookmark
- Subscribe
- Mute
- Subscribe to RSS Feed
- Permalink
- Report Inappropriate Content
Multiple Dimension aggregation Columns
Hello Everyone,
From the below sample data table. I want to create an aggregational table and later I will convert it to the scatter plot which shows aggregation of the Products based on their sales amount and Actual amounts. I considered using the ranking for this approach but I am not getting the results as expected.
sample data table:
| Product | Sales Amount | Actual Amount | Risk Value | Return Value |
| A | 60 | 5 | 20 | 15 |
| B | 50 | 100 | 25 | 25 |
| C | 70 | 70 | 55 | 35 |
| D | 20 | 35 | 15 | 30 |
| E | 10 | 25 | 17 | 15 |
| F | 5 | 30 | 20 | 20 |
Expected Result:
| Dimension | Risk Value | Return Value |
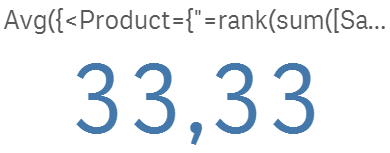
| Average of TOP 3 Products by Sales Amount | 33.33 | 25 |
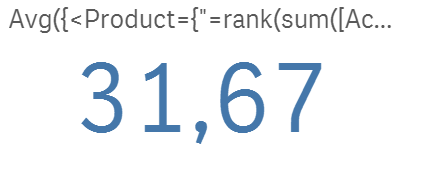
| Average of TOP 3 Products by Actual Amount | 31.66 | 30 |
Summary:
Average of TOP 3 Products by Sales Amounts: C,A,B are the Top 3 Products. Now I want Avg(Risk Value) and Avg(Return Value) of these Products.
Average of TOP 3 Products by Actual Amounts: B, C, D are the Top 3 Products. Now I want Avg(Risk Value) and Avg(Return Value) of these Products.
Expressions I am using:
Dimension Expression:
if(aggr(rank(sum( [Sales Amount])),[Product ID])<= 3,'Average of TOP 3 Products by Sales Amounts',
if(Aggr(rank(-sum( [Actual Amount])),[Product ID])<= 3 ,'Average of TOP 3 Products by Actual Amounts'))
Measured Expression:
Avg(Risk Value)
Avg(Return Value)
Thanks in Advance,
-Vidya
Accepted Solutions
- Mark as New
- Bookmark
- Subscribe
- Mute
- Subscribe to RSS Feed
- Permalink
- Report Inappropriate Content
So basically:
to have the first 3 products by sales amout:
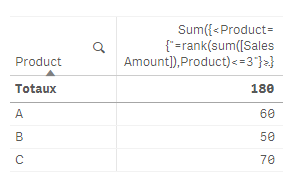
Sum({<Product={"=rank(sum([Sales Amount]),Product)<=3"}>}[Sales Amount])
to have the first 3 products by actual amount:
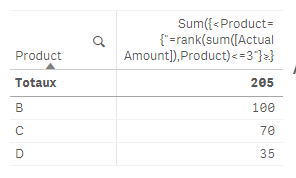
Sum({<Product={"=rank(sum([Actual Amount]),Product)<=3"}>}[Actual Amount])
so :
to have the avg of risk value depends on the top 3 based on sales amount:
Avg({<Product={"=rank(sum([Sales Amount]),Product)<=3"}>}[Risk Value])
to have the avg of risk value depends on the top 3 based on actual amount:
Avg({<Product={"=rank(sum([Actual Amount]),Product)<=3"}>}[Risk Value])
if u want to have this in a table:
as dimension:
=ValueList('Average of TOP 3 Products by Sales Amounts','Average of TOP 3 Products by Actual Amounts')
as a measure:
if(ValueList('Average of TOP 3 Products by Sales Amounts','Average of TOP 3 Products by Actual Amounts') =
'Average of TOP 3 Products by Sales Amounts', Avg({<Product={"=rank(sum([Sales Amount]),Product)<=3"}>}[Risk Value]),
if(ValueList('Average of TOP 3 Products by Sales Amounts','Average of TOP 3 Products by Actual Amounts') =
'Average of TOP 3 Products by Actual Amounts',Avg({<Product={"=rank(sum([Actual Amount]),Product)<=3"}>}[Risk Value])
))
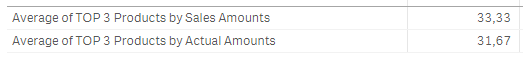
result:

- Mark as New
- Bookmark
- Subscribe
- Mute
- Subscribe to RSS Feed
- Permalink
- Report Inappropriate Content
So basically:
to have the first 3 products by sales amout:
Sum({<Product={"=rank(sum([Sales Amount]),Product)<=3"}>}[Sales Amount])
to have the first 3 products by actual amount:
Sum({<Product={"=rank(sum([Actual Amount]),Product)<=3"}>}[Actual Amount])
so :
to have the avg of risk value depends on the top 3 based on sales amount:
Avg({<Product={"=rank(sum([Sales Amount]),Product)<=3"}>}[Risk Value])
to have the avg of risk value depends on the top 3 based on actual amount:
Avg({<Product={"=rank(sum([Actual Amount]),Product)<=3"}>}[Risk Value])
if u want to have this in a table:
as dimension:
=ValueList('Average of TOP 3 Products by Sales Amounts','Average of TOP 3 Products by Actual Amounts')
as a measure:
if(ValueList('Average of TOP 3 Products by Sales Amounts','Average of TOP 3 Products by Actual Amounts') =
'Average of TOP 3 Products by Sales Amounts', Avg({<Product={"=rank(sum([Sales Amount]),Product)<=3"}>}[Risk Value]),
if(ValueList('Average of TOP 3 Products by Sales Amounts','Average of TOP 3 Products by Actual Amounts') =
'Average of TOP 3 Products by Actual Amounts',Avg({<Product={"=rank(sum([Actual Amount]),Product)<=3"}>}[Risk Value])
))
result:
- Mark as New
- Bookmark
- Subscribe
- Mute
- Subscribe to RSS Feed
- Permalink
- Report Inappropriate Content
Hi Omar,
You are really a genius. I really appreciate your help today. The expression you shared worked as expected. One last thing i would like to share is. I also want to include my own products example: If(wildmatch([Product],'*Micro*'),[Product]). Is there a way that I can add this if condition to the valuelist?
Thanks,
-Vidya
- Mark as New
- Bookmark
- Subscribe
- Mute
- Subscribe to RSS Feed
- Permalink
- Report Inappropriate Content
If I fully understand ur request:
Let's say you have 1000 products, but only 50 that contains Micro, and u want to to do the Avg for the top 3 of these 50?
Is that so?
If yes, u change ur expression from:
Avg({<Product={"=rank(sum([Sales Amount]),Product)<=3"}>}[Risk Value])
to
Avg({<Product={"=rank(sum( {<Product={=wildmatch([Product],'*Micro*')=1}>} [Sales Amount]),Product)<=3"}>}[Risk Value])
so: the final expressions would be:
as dimension:
=ValueList('Average of TOP 3 Products by Sales Amounts','Average of TOP 3 Products by Actual Amounts')
as a measure:
if(ValueList('Average of TOP 3 Products by Sales Amounts','Average of TOP 3 Products by Actual Amounts') =
'Average of TOP 3 Products by Sales Amounts',
Avg({<Product={"=rank(sum({<Product={=wildmatch([Product],'*Micro*')=1}>} [Sales Amount]),Product)<=3"}>}[Risk Value]),
if(ValueList('Average of TOP 3 Products by Sales Amounts','Average of TOP 3 Products by Actual Amounts') =
'Average of TOP 3 Products by Actual Amounts',
Avg({<Product={"=rank(sum({<Product={=wildmatch([Product],'*Micro*')=1}>} [Actual Amount]),Product)<=3"}>}[Risk Value])
))
- Mark as New
- Bookmark
- Subscribe
- Mute
- Subscribe to RSS Feed
- Permalink
- Report Inappropriate Content
Hi Omar,
I found the solution for this. let's follow the order.
- I have 1000 Products, But only 50 that contains Micro. Now I want to show Avg risk value of top 3 by sales amount of 1000 Products and individual Riks values of products that contains Micro.
Example:
Micro1 10.20
Mirco2 12.36
- Solution to achieve this requirement is.
load * inline [
Dim
1
2
3
4
5
6
7
8
9
10
];
Dimension:
=pick(Dim,'Average of TOP N Products by AUM: 1 YR Risk and Returns','Average of TOP N Products by 1 YR Flows: 1 YR Risk and Returns','Average of Bottom N Products by 1 YR Flows: 1 YR Risk and Returns',
if(WildMatch([Firm Name],'*Mirco*'),[Product Name]))
Measure:
=
PICK(Dim, Avg({<[Product ID]={"=rank(sum([Sales Amount]),[Product ID])<=10"}>}[Risk Value]),
Avg({<[Product ID]={"=rank(sum([Total Amount]),[Product ID])<=10"}>}[Risk Value]),
Avg({<[Product ID]={"=rank(-sum([Total Amount]),[Product ID])<=10"}>}[Risk Value]),
([Risk Value])
)
Thanks,
-Vidya