Unlock a world of possibilities! Login now and discover the exclusive benefits awaiting you.
- Qlik Community
- :
- Forums
- :
- Analytics
- :
- New to Qlik Analytics
- :
- Multiple Dimension and Multiple Measure in one cha...
- Subscribe to RSS Feed
- Mark Topic as New
- Mark Topic as Read
- Float this Topic for Current User
- Bookmark
- Subscribe
- Mute
- Printer Friendly Page
- Mark as New
- Bookmark
- Subscribe
- Mute
- Subscribe to RSS Feed
- Permalink
- Report Inappropriate Content
Multiple Dimension and Multiple Measure in one chart
Hi,
I want to include 3 dimension and 2 measure in one chart. any suggestion as to which chart can be used?
Thanks,
Ishan
- Mark as New
- Bookmark
- Subscribe
- Mute
- Subscribe to RSS Feed
- Permalink
- Report Inappropriate Content
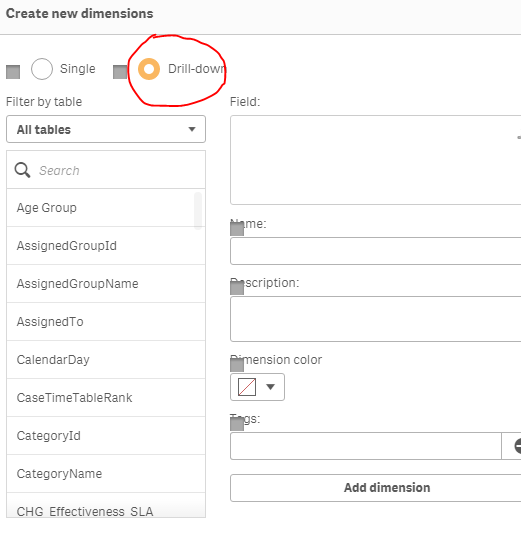
try drill down
go to master item create master dimension you will find below screen
- Mark as New
- Bookmark
- Subscribe
- Mute
- Subscribe to RSS Feed
- Permalink
- Report Inappropriate Content
Thanks Chanty. But the catch here is that it should be in the form of some map and not as a table.
- Mark as New
- Bookmark
- Subscribe
- Mute
- Subscribe to RSS Feed
- Permalink
- Report Inappropriate Content
Hi Bansal,
the below list will explain limitations of the charts in QS.so you can choose by yourself which is comfortable to you.
Without data understanding how can we suggest chart to you? so if possible share your fields at least/sample data.
Chart Type Dimension Expression
Bar Atmost 2 no limit
Line only 1 No limit
Pie Atmost 2 only 1
Gauge no dimension no limit
Pivot No limit No limit
Straight No limit No limit
Grid Atleast 3 only 1
Radar Only 1 No limit
Mekko Only 1 No limit
Bloack No limit Only 1
Funnal Only 1 Only 1
Scatter No limit Atmost 2 and 3rd expression decide the size of symbol
Combo Atmost 2 No limit
QV Reference manual says "Pie, line and scatter charts can display a maximum of two dimensions, bar, block and grid charts three". So try to use Bar/Line/Combo or Block or Grid charts.