Unlock a world of possibilities! Login now and discover the exclusive benefits awaiting you.
- Qlik Community
- :
- Forums
- :
- Analytics
- :
- New to Qlik Analytics
- :
- Re: Multiple Measures Plotted by Year
- Subscribe to RSS Feed
- Mark Topic as New
- Mark Topic as Read
- Float this Topic for Current User
- Bookmark
- Subscribe
- Mute
- Printer Friendly Page
- Mark as New
- Bookmark
- Subscribe
- Mute
- Subscribe to RSS Feed
- Permalink
- Report Inappropriate Content
Multiple Measures Plotted by Year
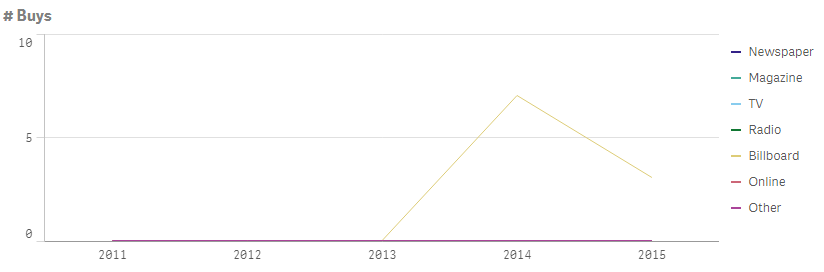
The task at hand is to plot the number buys in each media type (Newspaper, TV, Magazine, etc) for the last five years. In a line chart, I set a dimension of year and a measure of type. I created a measure for each type and created an expression such as: if (pubType='TV',aggr(count(pubType),jobYear),0))
This seems to work if a salesperson has buys of only one media type, if they have buys for 2015 in newspaper and TV, it plots nothing.
I have played with some set analysis expressions but can’t seem to get past this issue.
The attached image shows 3 newspaper buys in 2015 and 7 in 2014. 2013 should show 8 billboard, 1 newspaper and 1 online. It is at this point that my expression breaks.
Can anyone point me in the right direction on this one?
Accepted Solutions
- Mark as New
- Bookmark
- Subscribe
- Mute
- Subscribe to RSS Feed
- Permalink
- Report Inappropriate Content
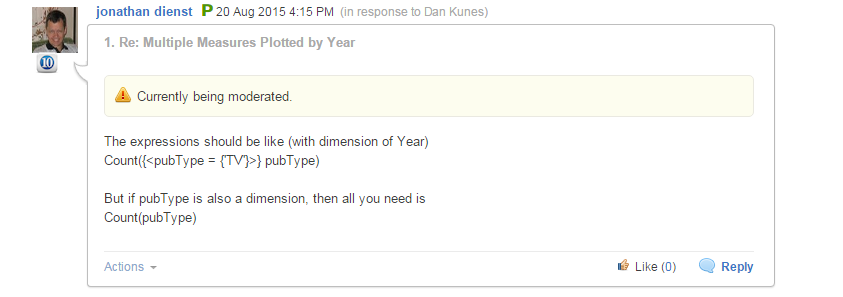
The expressions should be like (with dimension of Year)
Count({<pubType = {'TV'}>} pubType)
But if pubType is also a dimension, then all you need is
Count(pubType)
- Mark as New
- Bookmark
- Subscribe
- Mute
- Subscribe to RSS Feed
- Permalink
- Report Inappropriate Content
The expressions should be like (with dimension of Year)
Count({<pubType = {'TV'}>} pubType)
But if pubType is also a dimension, then all you need is
Count(pubType)
- Mark as New
- Bookmark
- Subscribe
- Mute
- Subscribe to RSS Feed
- Permalink
- Report Inappropriate Content
I have answered, but it has gone into moderation for no obvious reason...
- Mark as New
- Bookmark
- Subscribe
- Mute
- Subscribe to RSS Feed
- Permalink
- Report Inappropriate Content
Awesome! I've been trying everything under the sun...hard to believe I didn't try that...