Unlock a world of possibilities! Login now and discover the exclusive benefits awaiting you.
- Qlik Community
- :
- Forums
- :
- Analytics
- :
- New to Qlik Analytics
- :
- Multiples Chart
- Subscribe to RSS Feed
- Mark Topic as New
- Mark Topic as Read
- Float this Topic for Current User
- Bookmark
- Subscribe
- Mute
- Printer Friendly Page
- Mark as New
- Bookmark
- Subscribe
- Mute
- Subscribe to RSS Feed
- Permalink
- Report Inappropriate Content
Multiples Chart
Hi
Is there a way in Qlik Sense to create a multiples chart as per power view (MSBI)?
It is using the same set of data and adding in a dimension as Horizontal Multiples then it will plot out the charts separately in a sheet.
Example as attached.
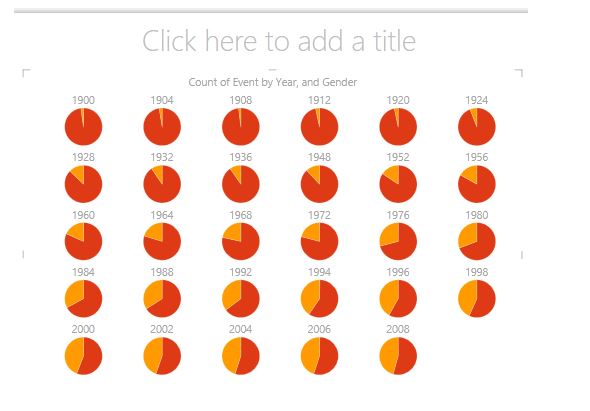
Tutorial: Create Amazing Power View Reports - Part 2 - Excel
Thanks in advance 
- Mark as New
- Bookmark
- Subscribe
- Mute
- Subscribe to RSS Feed
- Permalink
- Report Inappropriate Content
I guess creating multiple Pie charts should work?
Hard coding Year values in each Pie chart would show only related year..
- Mark as New
- Bookmark
- Subscribe
- Mute
- Subscribe to RSS Feed
- Permalink
- Report Inappropriate Content
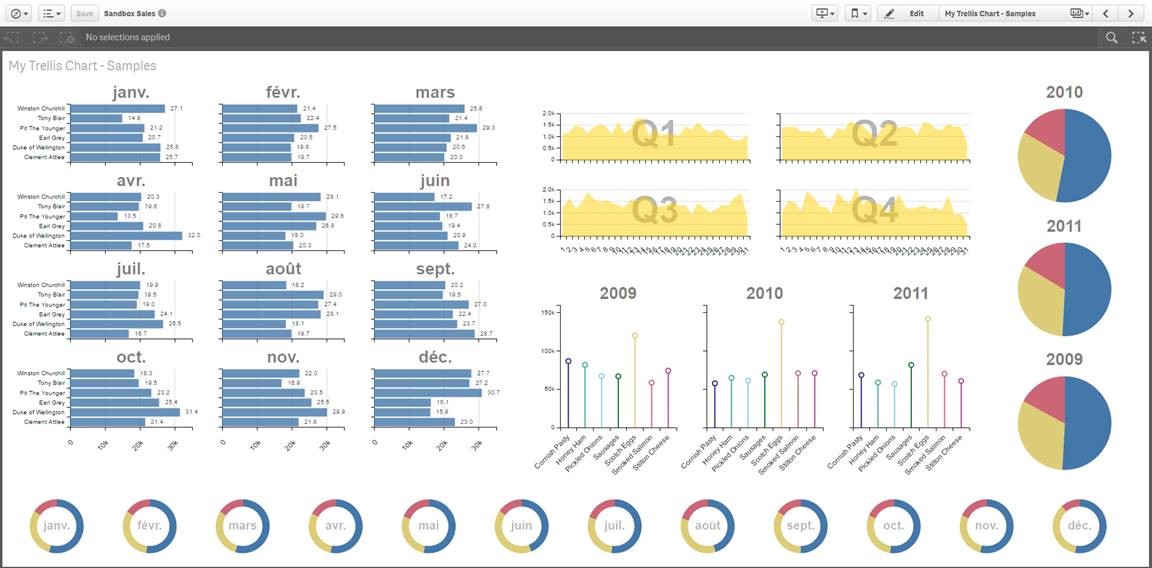
In QlikView it's called a Trellis chart, it is not a standard ffeature in Qlik Sense but completely doable with an extension (maybe even a widget).
I did a quick search and found this open source project: Qlik Branch - Qlik SenseTrellis Chart
Qlik Community MVP
- Mark as New
- Bookmark
- Subscribe
- Mute
- Subscribe to RSS Feed
- Permalink
- Report Inappropriate Content
Thanks Vegar.
The extension was able to plot for 1 measure only.
I tried to enter the 2nd measure but nothing came out.
Any idea to plot something like a combo chart but in Trellis?
Thanks!