Unlock a world of possibilities! Login now and discover the exclusive benefits awaiting you.
- Qlik Community
- :
- Forums
- :
- Analytics
- :
- New to Qlik Analytics
- :
- Need help on data association
- Subscribe to RSS Feed
- Mark Topic as New
- Mark Topic as Read
- Float this Topic for Current User
- Bookmark
- Subscribe
- Mute
- Printer Friendly Page
- Mark as New
- Bookmark
- Subscribe
- Mute
- Subscribe to RSS Feed
- Permalink
- Report Inappropriate Content
Need help on data association
Hi All,
I am pretty new in this and appreciate your kind advice on data association.
My data model is shown below:
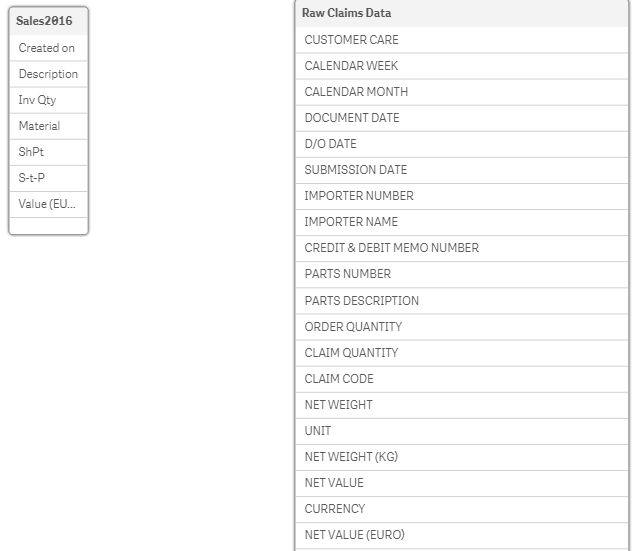
Left table is my sales data and right table is my claims data.
There are few fields that are common in both tables.
1. Created On = DOCUMENT DATE
2. S-t-P = IMPORTER NUMBER
3. Material = PARTS NUMBER
I would like to visualise following:
1. Claims vs Sales (%) per month
2. Claims vs Sales (%) by Customer
3. Claims vs Sales (%) by Part Description
Before I could create the visualisations, can somebody guide me on associating both data tables?
Thanks!!!
Alfie
Accepted Solutions
- Mark as New
- Bookmark
- Subscribe
- Mute
- Subscribe to RSS Feed
- Permalink
- Report Inappropriate Content
Hi Alfie,
You can create the Key Column like this.
[Created On]&'|'&[S-t-P]&'|'&[Material] as [KeyColumn]
[DOCUMENT DATE]&'|'&[IMPORTER NUMBER]&'|'&[PARTS NUMBER] as [KeyColumn]
The above keys are for the respective tables and the association will be done based on that. Join the main Columns and make the key column so that the data wont be cross join.
Tell me whether it works or not.
Regards,
Santosh.
- Mark as New
- Bookmark
- Subscribe
- Mute
- Subscribe to RSS Feed
- Permalink
- Report Inappropriate Content
Sounds like you should model your data like this.
Create the following dimension tables
Sales - > Unique sales fields
Claims - > Unique claim fields
Products -> Product name, Product Type
Customers -> Customer Name, Customer Type
You will need to create unique keys perhaps concatenating 2 or 3 fields to make the unique value if you do not have a unique sales or claim number.
Create a Fact table and load the common data into it.
ClaimsKey
SalesKey
ProductsKey -> Material = PARTS NUMBER
CustomerKey -> S-t-P = IMPORTER NUMBER
Fact Type = 'SALES VALUE (Euro), CLAIMS NET VALUE, CLAIMS NET VALUE (Euro) , Quanties Etc..'
Date -> Created On = DOCUMENT DATE
Value
Do this and you should have a model you can use to answer the questions you have asked and more.
Hope this helps
Regards
Andy
- Mark as New
- Bookmark
- Subscribe
- Mute
- Subscribe to RSS Feed
- Permalink
- Report Inappropriate Content
Hi Andy,
Appreciate your help.
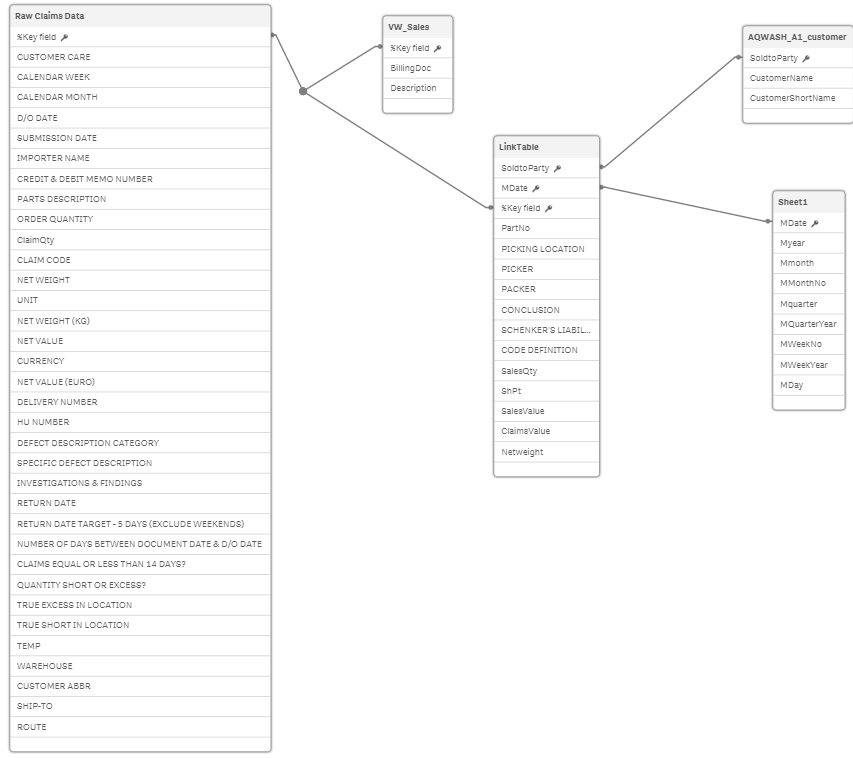
I have also searched online for some guides and I created a LinkTable to connect both fact tables as shown below.
I am able to plot something like this:

But when i filter by conclusion, the line graph shows 0%:
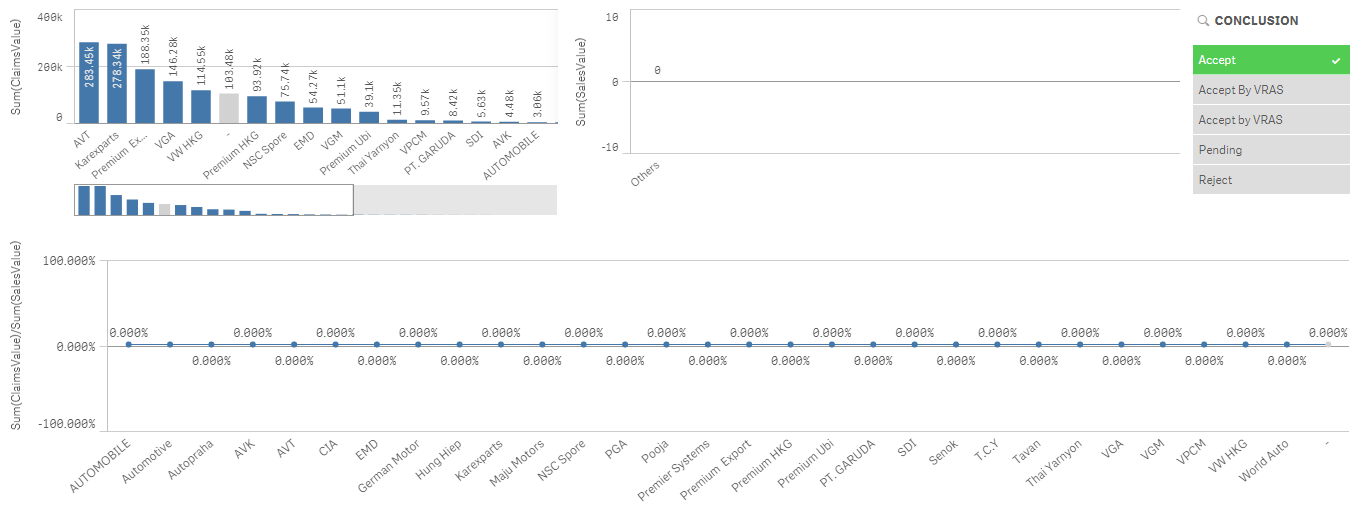
Can you please assist further?
Thank you.
- Mark as New
- Bookmark
- Subscribe
- Mute
- Subscribe to RSS Feed
- Permalink
- Report Inappropriate Content
Hi Alfie,
You can create the Key Column like this.
[Created On]&'|'&[S-t-P]&'|'&[Material] as [KeyColumn]
[DOCUMENT DATE]&'|'&[IMPORTER NUMBER]&'|'&[PARTS NUMBER] as [KeyColumn]
The above keys are for the respective tables and the association will be done based on that. Join the main Columns and make the key column so that the data wont be cross join.
Tell me whether it works or not.
Regards,
Santosh.
- Mark as New
- Bookmark
- Subscribe
- Mute
- Subscribe to RSS Feed
- Permalink
- Report Inappropriate Content
Hi Alfie,
You Can do the association using composite key.
For Sale2016 Table:
num([Created On])&'-'&[S-t-P]&'-'&[Material] as [Key]
convert [Created on] into num format else it will become trouble.
For Raw Claims Data Table:
num([DOCUMENT DATE])&'-'&[IMPORTER NUMBER]&'-'&[PARTS NUMBER] as [Key]
The two keys automatically get associated.
Thanks,