Unlock a world of possibilities! Login now and discover the exclusive benefits awaiting you.
- Qlik Community
- :
- Forums
- :
- Analytics
- :
- New to Qlik Analytics
- :
- Re: Need logic for distinct count of field in 1 we...
- Subscribe to RSS Feed
- Mark Topic as New
- Mark Topic as Read
- Float this Topic for Current User
- Bookmark
- Subscribe
- Mute
- Printer Friendly Page
- Mark as New
- Bookmark
- Subscribe
- Mute
- Subscribe to RSS Feed
- Permalink
- Report Inappropriate Content
Need logic for distinct count of field in 1 week only
Dear All,
We have to build a logic to count of brand sold particular month/Year.
however, we have to display this data w,r,t Week.
If one brand is sold in 1st week then it should not be counted again in another week of that month.
And this logic should work as per selection of Month/Year.
Sample Data:
Brand, Week, Area, Zone, Division, Month, Year
A, 1, Area1, Zone1, D1, JAN, 2018
A, 2, Area1, Zone1, D1, JAN, 2018
B, 2, Area1, Zone1, D1, FEB, 2018
B, 3, Area1, Zone1, D1, FEB, 2018
C, 1, Area1, Zone1, D1, JAN, 2018
C, 4, Area1, Zone1, D1, FEB, 2018
A, 4, Area1, Zone1, D1, MAR, 2018
Thanks in advance
- « Previous Replies
-
- 1
- 2
- Next Replies »
Accepted Solutions
- Mark as New
- Bookmark
- Subscribe
- Mute
- Subscribe to RSS Feed
- Permalink
- Report Inappropriate Content
May be this
Sum(Aggr(If(Brand <> Above(TOTAL Brand), 1, 0), Zone, Area, Brand, Week))
When JAN is selected

When nothing is selected

- Mark as New
- Bookmark
- Subscribe
- Mute
- Subscribe to RSS Feed
- Permalink
- Report Inappropriate Content
Hi stalwar1,
How do you want to see this? if you want to see this as a Table then add Week as Dimension (in Pivot table)
Expression:
Concat(distinct Brand,',')
- Mark as New
- Bookmark
- Subscribe
- Mute
- Subscribe to RSS Feed
- Permalink
- Report Inappropriate Content
It should be count of brand sold..
- Mark as New
- Bookmark
- Subscribe
- Mute
- Subscribe to RSS Feed
- Permalink
- Report Inappropriate Content
In your table there is no information on whether it is sold or not sold.
Is it possible to provide your app?
- Mark as New
- Bookmark
- Subscribe
- Mute
- Subscribe to RSS Feed
- Permalink
- Report Inappropriate Content
Dear All,
We have to build a logic to count of brand sold particular month/Year.
however, we have to display this data w,r,t Week.
If one brand is sold in 1st week then it should not be counted again in another week of that month.
here i have mentioned Sold Brand
- Mark as New
- Bookmark
- Subscribe
- Mute
- Subscribe to RSS Feed
- Permalink
- Report Inappropriate Content
May be like this:
Pivot table -
Dimensions: Other dimensions, week.
Expression: Brands sold on that week.
Count({ <Week = {"$(=Max(Week))"}> }Brand)
Or
Aggr(Count({ <Week = {"$(=Max(Week))"}> }Brand),Brand)
- Mark as New
- Bookmark
- Subscribe
- Mute
- Subscribe to RSS Feed
- Permalink
- Report Inappropriate Content
May be this:
Create Week list box,
This expr in pivot table.
Count({ <Week = {'$(=getfieldselections(Week))'}> }Brand)
- Mark as New
- Bookmark
- Subscribe
- Mute
- Subscribe to RSS Feed
- Permalink
- Report Inappropriate Content
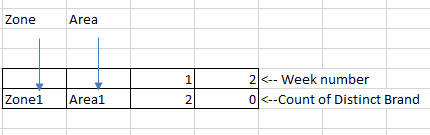
My expected output on selection month Jan should be as in attached Image
Update: - Updated Output
- Mark as New
- Bookmark
- Subscribe
- Mute
- Subscribe to RSS Feed
- Permalink
- Report Inappropriate Content
Yes above expr's specified based on Week number.. what's the result you are getting.
Count({ <Week = {'$(=getfieldselections(Week))'}, Month = {'$(=getfieldselections(Month))'} > }Brand)
Add: Zone, Area as Dimensions.
- Mark as New
- Bookmark
- Subscribe
- Mute
- Subscribe to RSS Feed
- Permalink
- Report Inappropriate Content
we cant consider week selection in set analysis.
there is Month/Year selection.
It should be min week always for any selection.
and column dimension will be Week in Pivot.
- « Previous Replies
-
- 1
- 2
- Next Replies »