Unlock a world of possibilities! Login now and discover the exclusive benefits awaiting you.
- Qlik Community
- :
- Forums
- :
- Analytics
- :
- New to Qlik Analytics
- :
- Re: Need to Create a chart with 2 dimensions and 2...
- Subscribe to RSS Feed
- Mark Topic as New
- Mark Topic as Read
- Float this Topic for Current User
- Bookmark
- Subscribe
- Mute
- Printer Friendly Page
- Mark as New
- Bookmark
- Subscribe
- Mute
- Subscribe to RSS Feed
- Permalink
- Report Inappropriate Content
Need to Create a chart with 2 dimensions and 2 Measures BAR CHART
Hello All.
Issue: how to create 2 Dimensions and 2 Measures Bar Chart.
2 - Dimensions are
1. Year
2. Month
2 - Measures are
1. Target Sales
2. Actual Sales
anyone please help 
- « Previous Replies
-
- 1
- 2
- Next Replies »
- Mark as New
- Bookmark
- Subscribe
- Mute
- Subscribe to RSS Feed
- Permalink
- Report Inappropriate Content
You will not get proper layout if you are using more than two dimensions in QlikView bar chart.
better to use....single dimension as below..
Year & CHR(10) & Month
or
Year & '-' & Month
and use both expressions as your have shown above..
Check below link for better understanding..
- Mark as New
- Bookmark
- Subscribe
- Mute
- Subscribe to RSS Feed
- Permalink
- Report Inappropriate Content
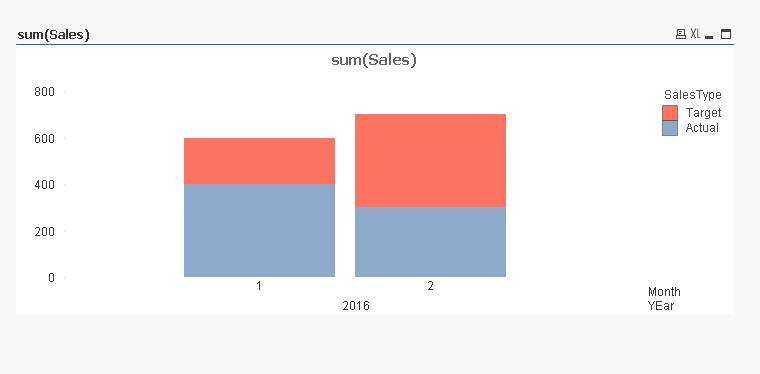
One thing you could do is combine your Actual and Target Sales Fields
Example
YEar Month SalesType Sales
2016,1,Target,200
2016,1,Actual,400
2016,2,Target,400
2016,2,Actual,300
This way you can create a chart like this
Dimension,Year,Month,SaleType
Expression: Sum(Sale)
If a post helps to resolve your issue, please accept it as a Solution.
- Mark as New
- Bookmark
- Subscribe
- Mute
- Subscribe to RSS Feed
- Permalink
- Report Inappropriate Content
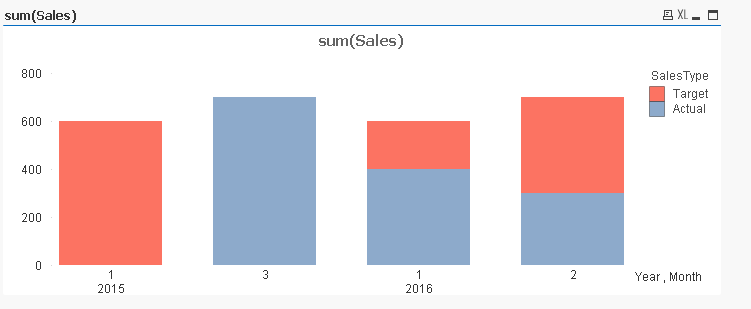
Hi Vieeeth.. if you have more than one year data with different months.. you will get issue..
check below data.
Load * Inline
[
YEar, Month, SalesType, Sales
2016,1,Target,200
2016,1,Actual,400
2016,2,Target,400
2016,2,Actual,300
2015,1,Target,200
2015,3,Actual,400
2015,1,Target,400
2015,3,Actual,300
];
- Mark as New
- Bookmark
- Subscribe
- Mute
- Subscribe to RSS Feed
- Permalink
- Report Inappropriate Content
what Kind of issues? it's up to the op to add Set analysis to filter for what year he wants
If a post helps to resolve your issue, please accept it as a Solution.
- Mark as New
- Bookmark
- Subscribe
- Mute
- Subscribe to RSS Feed
- Permalink
- Report Inappropriate Content
ok, you mean missing months for a year. But I think the major problem here was having 2 expressions, which won't be the case
Changed Dimension to
Dim1 = Month & chr(10)& YEar
Dim2 = SalesType
Expression = Sum(Sales)
Sort = NUM(YEar&Month)
If a post helps to resolve your issue, please accept it as a Solution.
- Mark as New
- Bookmark
- Subscribe
- Mute
- Subscribe to RSS Feed
- Permalink
- Report Inappropriate Content
To Avoid repeating labels
Dimension
Dim1 =AGGR(if(Month = Min(TOTAL <YEar> Month),Month & chr(10)&YEar,Month),YEar,Month)
Dim2 = SalesType
Expression = Sum(Sales)
Sort = NUM(YEar&Month) > Ascending
If a post helps to resolve your issue, please accept it as a Solution.
- Mark as New
- Bookmark
- Subscribe
- Mute
- Subscribe to RSS Feed
- Permalink
- Report Inappropriate Content
This will confuse more to end user... In short you can't avoid non associated month with years directly..
- Mark as New
- Bookmark
- Subscribe
- Mute
- Subscribe to RSS Feed
- Permalink
- Report Inappropriate Content
Sorry I didn't quite get what you are trying to say? what is wrong here? This is fairly simple
If a post helps to resolve your issue, please accept it as a Solution.
- Mark as New
- Bookmark
- Subscribe
- Mute
- Subscribe to RSS Feed
- Permalink
- Report Inappropriate Content
I mean to say technically it's correct, but when you are showing to users, it would be difficult for them to understand..because not all months are joined with years on x axis..
Better to use
Month&'-'Year
or
Year&'-'&Month
- « Previous Replies
-
- 1
- 2
- Next Replies »