Unlock a world of possibilities! Login now and discover the exclusive benefits awaiting you.
- Qlik Community
- :
- Forums
- :
- Analytics
- :
- New to Qlik Analytics
- :
- Nested If in For loop during Data Load
- Subscribe to RSS Feed
- Mark Topic as New
- Mark Topic as Read
- Float this Topic for Current User
- Bookmark
- Subscribe
- Mute
- Printer Friendly Page
- Mark as New
- Bookmark
- Subscribe
- Mute
- Subscribe to RSS Feed
- Permalink
- Report Inappropriate Content
Nested If in For loop during Data Load
Hi All,
I am trying to compute a YTD total sales during the data load in Qlik Sense.
Basically, my idea is to use a For Loop to loop through the dates and if the conditions are right, i will sum up the sales figure.
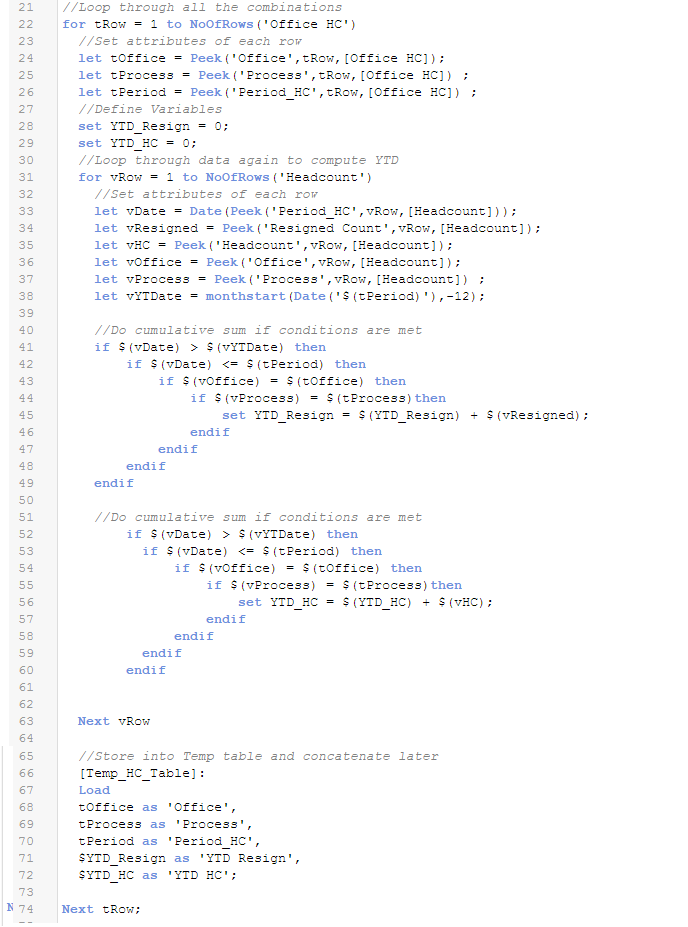
Below is a snapshot of my code. (Apologies, i don't know how to insert the code tag from Qlik Sense)
But i got an error but i am not sure why.
The error occurred in line 41:
if 12/1/2012 <= 2012-11-01 00:00:00 then
Accepted Solutions
- Mark as New
- Bookmark
- Subscribe
- Mute
- Subscribe to RSS Feed
- Permalink
- Report Inappropriate Content
May be convert both those dates into number using num() function and then do a comparison:
LET vDate = Num(Date(Peek('Period_HC', vRow, [Headcount])));
LET vYTDate = Num(MonthStart(Date('$(tPeriod)'), -12));
- Mark as New
- Bookmark
- Subscribe
- Mute
- Subscribe to RSS Feed
- Permalink
- Report Inappropriate Content
Honestly I believe that you are trying it a little bit too complicated. YTD calculations are quite easy within the gui with set analysis expressions especially if you used a master-calendar with flags. Here you find everything what you need: How to use - Master-Calendar and Date-Values
- Marcus
- Mark as New
- Bookmark
- Subscribe
- Mute
- Subscribe to RSS Feed
- Permalink
- Report Inappropriate Content
H Marcus,
The YTD flag doesn't work for for rolling YTD sum right? (Correct me if I'm wrong)
I have the used the set analysis expression and it works brilliantly in tables.
However, when I try to use the same expression on a chart, the YTD sum doesn't work.
It seems that data outside the time frame of the chart do not get aggregated.
Let me know if there there is something that I can try.
Thanks!
- Mark as New
- Bookmark
- Subscribe
- Mute
- Subscribe to RSS Feed
- Permalink
- Report Inappropriate Content
Yes, principally you need for each metric an own flag (nesting of flags is possible but complicated) which later led ideally to gui-expression like: sum(value) * YTDFlag or sum(value) * R12Flag and so on. If it worked in tables it will also work in charts but you might need to reduce the number of dimensions and expressions to get good results.
- Marcus
- Mark as New
- Bookmark
- Subscribe
- Mute
- Subscribe to RSS Feed
- Permalink
- Report Inappropriate Content
Hi Marcus,
In the table, the YTD sales for a time period (e.g. Jan'15) will show an aggregration of sums from Feb'14 to Jan'15. This is perfect.
However, when I apply it in a chart which shows the YTD data (e.g. Nov'15 to Oct'15), only the cumulative sum is shown. (i.e. Nov'15 will only show Nov'15 Sales while Dec'15 will show Nov'15 + Dec'15 sales)
- Mark as New
- Bookmark
- Subscribe
- Mute
- Subscribe to RSS Feed
- Permalink
- Report Inappropriate Content
I don't understand - you mean if you select further months? By many of those flags made it no sense to enable further period-selections then it's rather confusing.
- Marcus
- Mark as New
- Bookmark
- Subscribe
- Mute
- Subscribe to RSS Feed
- Permalink
- Report Inappropriate Content
I uploaded a copy of the QVF.
The table shows the Cumulative Sum but the Chart only shows cumulative sum from Nov onward.
Ideally, I would like to see the cumulative sum (1200) since 2013.

- Mark as New
- Bookmark
- Subscribe
- Mute
- Subscribe to RSS Feed
- Permalink
- Report Inappropriate Content
Impossible!)))
Bit evil genius never not sleeping...)
- Mark as New
- Bookmark
- Subscribe
- Mute
- Subscribe to RSS Feed
- Permalink
- Report Inappropriate Content
Unfortunately I can't look into your qvf but both objects haven't the same expressions. The table-expression isn't a cumulative expression it's a TOTAL. Your chart instead seems to have a cumulation.
I suggest you take another look into my suggestion from above - How to use - Master-Calendar and Date-Values - the examples are related to qlikview but you will find similar ones for sense and logic and script-syntax are for both the same.
- Marcus