Unlock a world of possibilities! Login now and discover the exclusive benefits awaiting you.
- Qlik Community
- :
- Forums
- :
- Analytics
- :
- New to Qlik Analytics
- :
- Re: Pareto Chart
- Subscribe to RSS Feed
- Mark Topic as New
- Mark Topic as Read
- Float this Topic for Current User
- Bookmark
- Subscribe
- Mute
- Printer Friendly Page
- Mark as New
- Bookmark
- Subscribe
- Mute
- Subscribe to RSS Feed
- Permalink
- Report Inappropriate Content
Pareto Chart
Hi All,
Iam new to Qlik sense, can any one help me how to create Pareto Chart, please find below my requirements.
not able to write expression for height of the line.
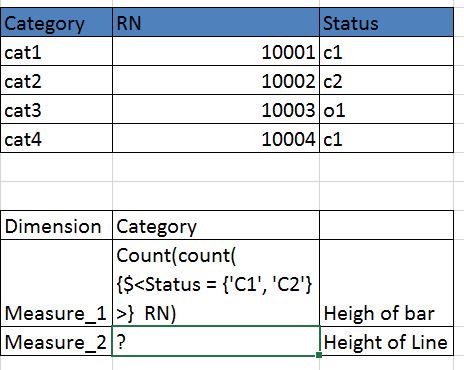
Dimension : Category
Measure1 : Count(count({$<Status = {'C1', 'C2'}>} RN) ------> Heigh of Bar
Measure 2: ? (heigh of line for pareto analysis)
- Mark as New
- Bookmark
- Subscribe
- Mute
- Subscribe to RSS Feed
- Permalink
- Report Inappropriate Content
- Mark as New
- Bookmark
- Subscribe
- Mute
- Subscribe to RSS Feed
- Permalink
- Report Inappropriate Content
Create Combo chart
Dimension: Category
Measure 1: count({$<Status = {'C1', 'C2'}>} RN)
Measure 2: rangesum(above(count({$<Status = {'C1', 'C2'}>} RN),0,rowno()))/
$(=count({$<Status = {'C1', 'C2'}>} RN))
Set measure 1 as bar chart and primary axis. Measure 2 as line and secondary axis. Set Measure 2 Number formatting to custom and the pattern to '# ##0%' for percentages.