Unlock a world of possibilities! Login now and discover the exclusive benefits awaiting you.
- Qlik Community
- :
- Forums
- :
- Analytics
- :
- New to Qlik Analytics
- :
- Re: Pivot Table - Extra row for min/max/average/to...
- Subscribe to RSS Feed
- Mark Topic as New
- Mark Topic as Read
- Float this Topic for Current User
- Bookmark
- Subscribe
- Mute
- Printer Friendly Page
- Mark as New
- Bookmark
- Subscribe
- Mute
- Subscribe to RSS Feed
- Permalink
- Report Inappropriate Content
Pivot Table - Extra row for min/max/average/total values
Hi everyone,
I'm having a pivot table where I'd like to have 4 extra row at the bottom of it where I can have:
1st row: min of my column
2nd row: max of my column
3rd row: average of my column
4th row: total count of my column
and that is of course for each one of my columns.
Is there a way to do that with Qlik sense? Or should I get an extension? If so which one would you suggest?
Thank you again!
Simon
- Mark as New
- Bookmark
- Subscribe
- Mute
- Subscribe to RSS Feed
- Permalink
- Report Inappropriate Content
Hi Simon,
Please use Valuelist, it is one of the Synthetic dimension.
Here is the link to explore:
- Mark as New
- Bookmark
- Subscribe
- Mute
- Subscribe to RSS Feed
- Permalink
- Report Inappropriate Content
Hi, Simon. Try this
- Mark as New
- Bookmark
- Subscribe
- Mute
- Subscribe to RSS Feed
- Permalink
- Report Inappropriate Content
Hi Andrey,
Thanks for your answer but I only have Qlik sense so I can't open any qvw files.
Simon
- Mark as New
- Bookmark
- Subscribe
- Mute
- Subscribe to RSS Feed
- Permalink
- Report Inappropriate Content
It's in qvw
Load script:
LOAD * Inline [
PART, Amount
P1, 7288.21
P1, 7288.21
P1, 8726.46
P1, 9505.7
P2, 6732.4
P2, 7060.95
P2, 7162.55
P2, 7267.1
P2, 7288.21
];
[DummyDim]:
LOAD * Inline [
$DummyDim
RealDim
TOTAL Min
TOTAL Max
TOTAL Avg
];
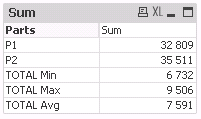
Dimesion:
=If([$DummyDim] = 'RealDim', [PART], [$DummyDim])
Expression:
If([$DummyDim] = 'RealDim', Sum(Amount),
If([$DummyDim] = 'TOTAL Min', Min(Amount),
If([$DummyDim] = 'TOTAL Max', Max(Amount),
If([$DummyDim] = 'TOTAL Avg', Avg(Amount) ))))
Or see these two blog posts: