Unlock a world of possibilities! Login now and discover the exclusive benefits awaiting you.
- Qlik Community
- :
- Forums
- :
- Analytics
- :
- New to Qlik Analytics
- :
- Pivot Table Help
- Subscribe to RSS Feed
- Mark Topic as New
- Mark Topic as Read
- Float this Topic for Current User
- Bookmark
- Subscribe
- Mute
- Printer Friendly Page
- Mark as New
- Bookmark
- Subscribe
- Mute
- Subscribe to RSS Feed
- Permalink
- Report Inappropriate Content
Pivot Table Help
I have an excel sheet where we have several columns that list a specific checklist item and if the checklist item is defective the next column will list the defect.
I need a pivot table that will list all of the headings and the vehicle id as a row and then need to count the number of Defective items and also list the defects on the measure side of the pivot table by region.
This is the excel sheet
| Vehicle Inspection Date and Time Submitted | Region | Truck No. | Headlights Low and High Beam | Headlights Low and High Beam Defect | Front Left/Right Turn Signals | Front Left/Right Turn Signals Defect | Windshield | Windshield Defect |
| 2019-01-01 05:02:40 | Midcon | TF10045 | DEFECTIVE | CRACKED HEADLIGHTS | Good Operating Condition | Good Operating Condition | ||
| 2019-01-01 05:11:22 | PERMIAN | TF10075 | DEFECTIVE | DEFECTIVE | RIGHT SIGNAL GETS STUCK | Good Operating Condition | ||
| 2019-01-01 05:39:53 | Midcon | TF10069 | Good Operating Condition | Good Operating Condition | DEFECTIVE | CRACK IN WINDSHIELD |
Pivot table needs to look similar to below when expanded.
|
| Midcon | Permian |
| # of Defects | Defects |
|
[Headlights Low and High Beam Defect | 3 |
|
|
TF10045 | 1 | cracked headlights |
|
TF10075 | 2 |
|
|
[Front Left/Right Turn Signals Defect | 1 |
|
|
TF10075 | 1 |
| right signal gets stuck |
[Windshield Defect | 1 |
|
|
TF10069 | 1 | crack in windshield |
|
- Mark as New
- Bookmark
- Subscribe
- Mute
- Subscribe to RSS Feed
- Permalink
- Report Inappropriate Content
Try Something like this -
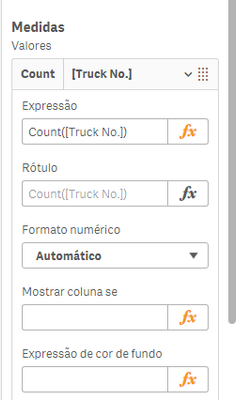
for the measure - do check the business requirement to understand what defines a defect .. .. but the measure could be something like this

