Unlock a world of possibilities! Login now and discover the exclusive benefits awaiting you.
- Qlik Community
- :
- Forums
- :
- Analytics
- :
- New to Qlik Analytics
- :
- Pivot Table in Qliksense
- Subscribe to RSS Feed
- Mark Topic as New
- Mark Topic as Read
- Float this Topic for Current User
- Bookmark
- Subscribe
- Mute
- Printer Friendly Page
- Mark as New
- Bookmark
- Subscribe
- Mute
- Subscribe to RSS Feed
- Permalink
- Report Inappropriate Content
Pivot Table in Qliksense
Hi Experts,
How can I achieve below table in qliksense.
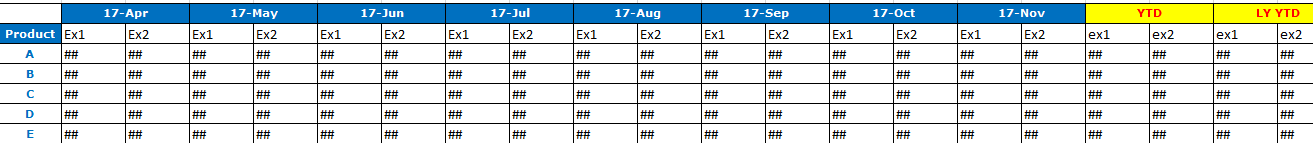
In That :
Product Is my Dimension
MonthYear is my Column
Exp1 and Exp2 is my measures .
Please guide me.
Regards,
Arvind Patil
- « Previous Replies
-
- 1
- 2
- Next Replies »
Accepted Solutions
- Mark as New
- Bookmark
- Subscribe
- Mute
- Subscribe to RSS Feed
- Permalink
- Report Inappropriate Content
Hi,
Find the expected output in attached QVF.
Regards,
Kaushik Solanki
- Mark as New
- Bookmark
- Subscribe
- Mute
- Subscribe to RSS Feed
- Permalink
- Report Inappropriate Content
Please help ,
Any Extension or is this possible in pivot or not.
Regards,
Arvind Patil
- Mark as New
- Bookmark
- Subscribe
- Mute
- Subscribe to RSS Feed
- Permalink
- Report Inappropriate Content
Hi,
Find the expected output in attached QVF.
Regards,
Kaushik Solanki
- Mark as New
- Bookmark
- Subscribe
- Mute
- Subscribe to RSS Feed
- Permalink
- Report Inappropriate Content
Thanks for reply ,
but what you gave me that is not what i actually looking for.
Regards,
Arvind Patil
- Mark as New
- Bookmark
- Subscribe
- Mute
- Subscribe to RSS Feed
- Permalink
- Report Inappropriate Content
Then what are you looking for?
The output is similar to what you have shown in image.
Regards,
Kaushik Solanki
- Mark as New
- Bookmark
- Subscribe
- Mute
- Subscribe to RSS Feed
- Permalink
- Report Inappropriate Content
One way to do this would be to load a new field when you load your data.
if(Year([Date])= year(Today()),
if( num(Month([Date]))<num(Month(Today())),(Exp1)))
As Exp1_ToDate_CY,
if(Year([Date])= year(Today())-1,
if( num(Month([Date]))<num(Month(Today())),(Exp1)))
As Exp1_ToDate_PY,
In your chart calculation, calculate Exp1_ToDate_CY - Exp1_ToDate_PY.
This code is not tested and you may get a syntax error. But you'll get the logic here.
Let me know if this works out for you. 
- Mark as New
- Bookmark
- Subscribe
- Mute
- Subscribe to RSS Feed
- Permalink
- Report Inappropriate Content
Sorry My Bad.. It seems i uploaded a wrong one.
I have changed it. Please check new one.
Regards,
Kaushik Solanki
- Mark as New
- Bookmark
- Subscribe
- Mute
- Subscribe to RSS Feed
- Permalink
- Report Inappropriate Content
Thanks for prompt response.
no its completely different you gave me one scatter chart and one text object  .
.
I require pivot table in above mentioned format.
Regards,
Arvind Patil
- Mark as New
- Bookmark
- Subscribe
- Mute
- Subscribe to RSS Feed
- Permalink
- Report Inappropriate Content
In my previous post. Replaced the old one with new one.
You can see a name difference i.e New file name is Comm285777.qvf
Regards,
Kaushik Solanki
- Mark as New
- Bookmark
- Subscribe
- Mute
- Subscribe to RSS Feed
- Permalink
- Report Inappropriate Content
Hi Adwitya,
No its not that way. I have already Year month wise data I want it on pivot table
regards,
Arvind Patil
- « Previous Replies
-
- 1
- 2
- Next Replies »