Unlock a world of possibilities! Login now and discover the exclusive benefits awaiting you.
- Qlik Community
- :
- Forums
- :
- Analytics
- :
- New to Qlik Analytics
- :
- Pivot Table, periods PM1, YTD, PM12 for each year
- Subscribe to RSS Feed
- Mark Topic as New
- Mark Topic as Read
- Float this Topic for Current User
- Bookmark
- Subscribe
- Mute
- Printer Friendly Page
- Mark as New
- Bookmark
- Subscribe
- Mute
- Subscribe to RSS Feed
- Permalink
- Report Inappropriate Content
Pivot Table, periods PM1, YTD, PM12 for each year
Hi,
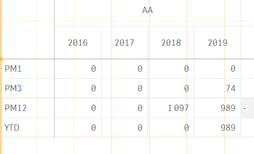
I would create a pivot table with Year as Column, Perdiod P1M, P3M, P12M, YTD as Line (ValueList) and the mesure based on Period (ValueList).
If today is 12.08.2019, PM1 is july 2019, PM3 is May to July, PM12 is August 2018 to July 2019, YTD Januar 2019 to Today.
The same principle to 2018.
I added a capture to may Pivot Table.
My Measure based on valueList :
If(ValueList('PM1', 'PM3', 'PM12', 'YTD') = 'PM1',
Count({<Date ={">=$(=MonthStart(Today(), -1))<=$(=MonthEnd(Today(), -1))"}, [Repair] = {'Repair'}>} distinct Orders) +
Count({<Date ={">=$(=MonthStart(Today(), -1))<=$(=MonthEnd(Today(), -1))"}, [Repair] = {'Repair T'}>} distinct Orders),
If(ValueList('PM1', 'PM3', 'PM12', 'YTD') = 'PM3',
Count({<Date ={">=$(=MonthStart(Today(), -3))<=$(=MonthEnd(Today(), -1))"}, [Repair] = {'Repair '}>} distinct Orders) +
Count({<Date ={">=$(=MonthStart(Today(), -3))<=$(=MonthEnd(Today(), -1))"}, [Repair] = {'Repair T'}>} distinct Orders),
If(ValueList('PM1', 'PM3', 'PM12', 'YTD') = 'PM12',
Count({<Date ={">=$(=MonthStart(Today(), -12))<=$(=MonthEnd(Today(), -1))"}, [Repair] = {'Repair '}>} distinct Orders) +
Count({<Date ={">=$(=MonthStart(Today(), -12))<=$(=MonthEnd(Today(), -1))"}, [Repair] = {'Repair T'}>} distinct Orders),
If(ValueList('PM1', 'PM3', 'PM12', 'YTD') = 'YTD',
Count({<Date ={">=$(=YearStart(Today(), 0))<=$(=AddYears(Today(), 0))"}, [Repair] = {'Repair '}>} distinct Orders) +
Count({<Date ={">=$(=YearStart(Today(), 0))<=$(=AddYears(Today(), 0))"}, [Repair] = {'Repair T'}>} distinct Orders)))))
Thanks for your help !
Regrds,
Fred
- Tags:
- pivot tables
- Mark as New
- Bookmark
- Subscribe
- Mute
- Subscribe to RSS Feed
- Permalink
- Report Inappropriate Content
Hi Fred,
Try like this:
Table:
LOAD * INLINE [
Month, Year, Date, Order, FlagCurrentMonth
1, 2019, 1/1/2019, 10, 0
2, 2019, 2/1/2019, 15, 0
3, 2019, 3/1/2019, 25, 0
4, 2019, 4/1/2019, 5, 1
1, 2018, 1/1/2018, 3, 0
2, 2018, 2/1/2018, 6, 0
3, 2018, 3/1/2018, 1, 0
4, 2018, 4/1/2018, 9, 0
1, 2017, 1/1/2017, 4, 0
2, 2017, 2/1/2017, 8, 0
3, 2017, 3/1/2017, 2, 0
4, 2017, 4/1/2017, 6, 0
];
Measure:
PM1:
Sum({<Month= {">=$(=(Max({<FlagCurrentMonth = {1} >}Month) - 1)) <=$(=(Max({<FlagCurrentMonth = {1} >}Month) - 1))"} >}Order)PM3:
Sum({<Month= {">=$(=(Max({<FlagCurrentMonth = {1} >}Month) - 3)) <=$(=(Max({<FlagCurrentMonth = {1} >}Month) - 1))"} >}Order)YTD:
Sum({<Month= {">=1 <=$(=(Max({<FlagCurrentMonth = {1} >}Month)))"} >}Order)Current Month:
Sum({<Month= {">=$(=(Max({<FlagCurrentMonth = {1} >}Month))) <=$(=(Max({<FlagCurrentMonth = {1} >}Month)))"} >}Order)
Hope this help 😀
Justin

