Unlock a world of possibilities! Login now and discover the exclusive benefits awaiting you.
- Qlik Community
- :
- Forums
- :
- Analytics
- :
- New to Qlik Analytics
- :
- Pivot table percentages from count of values
- Subscribe to RSS Feed
- Mark Topic as New
- Mark Topic as Read
- Float this Topic for Current User
- Bookmark
- Subscribe
- Mute
- Printer Friendly Page
- Mark as New
- Bookmark
- Subscribe
- Mute
- Subscribe to RSS Feed
- Permalink
- Report Inappropriate Content
Pivot table percentages from count of values
Hi there,
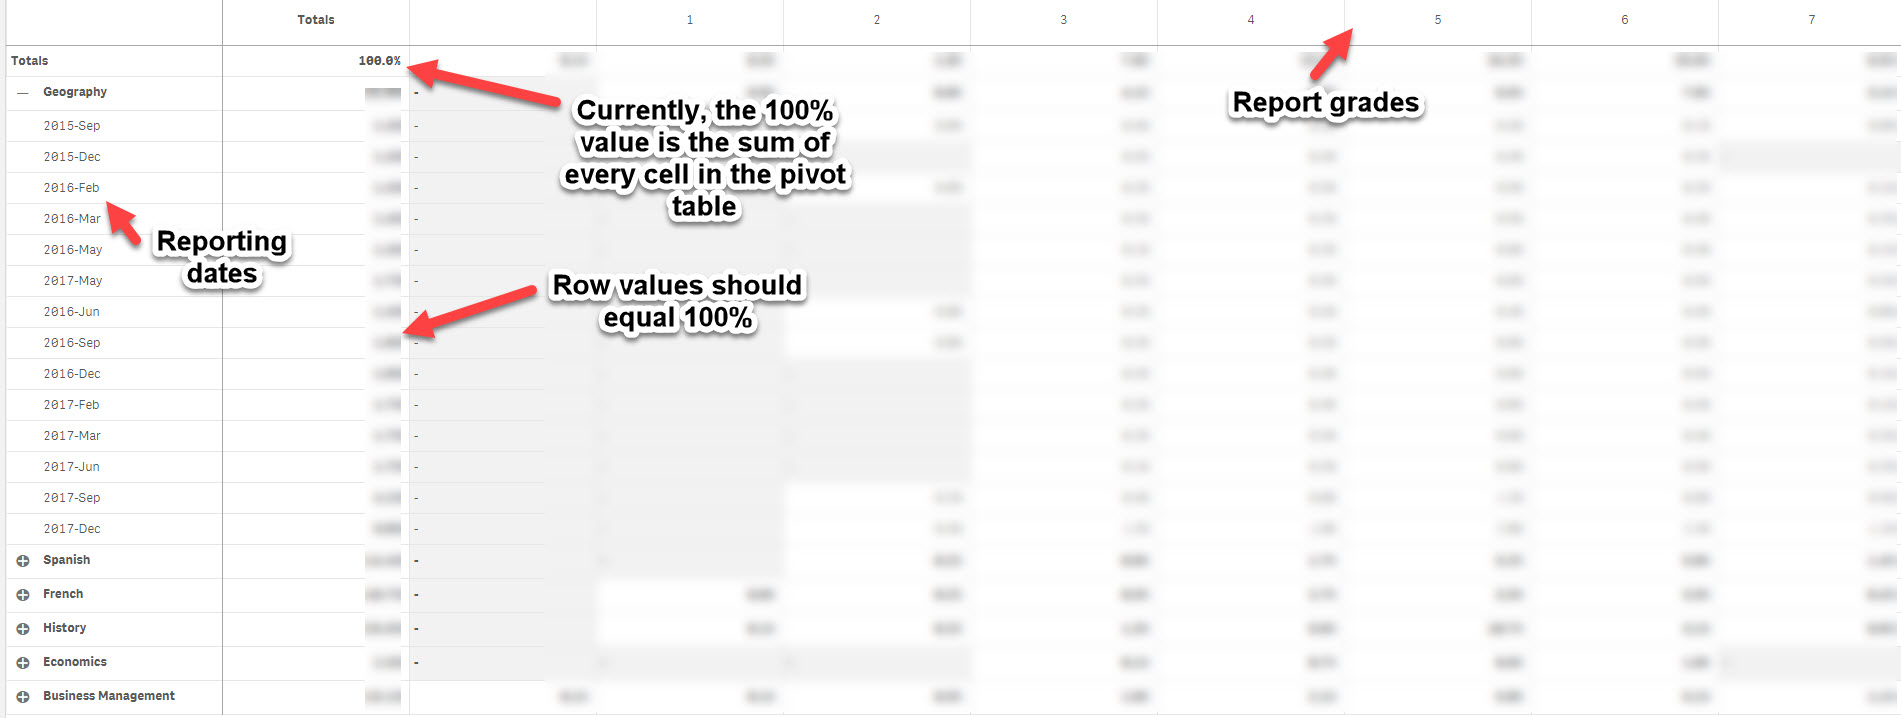
I'm trying to create a pivot table that shows the percentage of a count of values. The rows should equal 100% (for each date).
At the moment I've used this:
Count(Attainment) / count(total <[Pupil report data.Subject]> Attainment)
This isn't working as it is returning a total of 100% for every value in the pivot table, not by row or subject.
Any ideas would be much appreciated!
Many thanks
Matt
- Mark as New
- Bookmark
- Subscribe
- Mute
- Subscribe to RSS Feed
- Permalink
- Report Inappropriate Content
What all dimensions do you have in this chart?
- Mark as New
- Bookmark
- Subscribe
- Mute
- Subscribe to RSS Feed
- Permalink
- Report Inappropriate Content
For the rows, the dimensions are:
- Pupil assessment data.Subject
- Report Cycle.autoCalendar.YearMonth
And the column dimension is 'Attainment'
Thanks
Matt
- Mark as New
- Bookmark
- Subscribe
- Mute
- Subscribe to RSS Feed
- Permalink
- Report Inappropriate Content
Does have anyone have any nuggets of info they could offer? 
Thanks
Matt
- Mark as New
- Bookmark
- Subscribe
- Mute
- Subscribe to RSS Feed
- Permalink
- Report Inappropriate Content
Can you share some sample table?
- Mark as New
- Bookmark
- Subscribe
- Mute
- Subscribe to RSS Feed
- Permalink
- Report Inappropriate Content
Try with
Count(Attainment) / count(total <[Report Cycle.autoCalendar.YearMonth]> Attainment)
- Mark as New
- Bookmark
- Subscribe
- Mute
- Subscribe to RSS Feed
- Permalink
- Report Inappropriate Content
Try:
Sum(Attainment) / Sum(Total Attainment)
it should work for you. Don't forget to format the number as %
- Mark as New
- Bookmark
- Subscribe
- Mute
- Subscribe to RSS Feed
- Permalink
- Report Inappropriate Content
Hi,
Unfortunately this doesn't work... The result is the same as in the example I showed.
Matt
- Mark as New
- Bookmark
- Subscribe
- Mute
- Subscribe to RSS Feed
- Permalink
- Report Inappropriate Content
Hi Carlos,
Unfortunately, this also doesn't work. I have the same result as above.
Matt
- Mark as New
- Bookmark
- Subscribe
- Mute
- Subscribe to RSS Feed
- Permalink
- Report Inappropriate Content
Yes, I'll remove names etc. from the data and upload it ASAP.
Thank you,
Matt