Unlock a world of possibilities! Login now and discover the exclusive benefits awaiting you.
- Qlik Community
- :
- Forums
- :
- Analytics
- :
- New to Qlik Analytics
- :
- Re: Pivot table sorting
- Subscribe to RSS Feed
- Mark Topic as New
- Mark Topic as Read
- Float this Topic for Current User
- Bookmark
- Subscribe
- Mute
- Printer Friendly Page
- Mark as New
- Bookmark
- Subscribe
- Mute
- Subscribe to RSS Feed
- Permalink
- Report Inappropriate Content
Pivot table sorting
Hi,
I wish to have 3 option button's in my dashboard which should work such as when i click 1st option it should sort my pivot table & show me only the top 50 sales data, when i select 2nd option it should sort my pivot table & show me only the 51 to 100 data at last my 3rd option selection should show me the last 50 data. Is it possible in Qliksense? If so please help me with the next steps.
Thanks In advance.
- Tags:
- pivot sort
- scripitng
Accepted Solutions
- Mark as New
- Bookmark
- Subscribe
- Mute
- Subscribe to RSS Feed
- Permalink
- Report Inappropriate Content
hi can you try something like
create one variable i.e showhide
and 3 buttons
1) top50 and in actions external->setvariable variable:showhide value:1
2)50 to 100 same as above value:2
3)bottom 50 same as above value:3
dimension:Name
1)top 50 sales
expression:=Sum({<Name={"=rank(Sales)<50"}>}Sales)
in layout->conditional: If(showhide=1,1,0)
2) 50 to 100
=Sum({<Name={"=(rank(Sales)>50 and rank(Sales)<=100)"}>}Sales)
in layout->conditional: If(showhide=2,1,0)
3)bottom 50
=Sum({<Name={"=rank(Sales)>50"}>}Sales)
in layout->conditional: If(showhide=3,1,0)
hope this will help
- Mark as New
- Bookmark
- Subscribe
- Mute
- Subscribe to RSS Feed
- Permalink
- Report Inappropriate Content
I think that you are going to need to look at Qlik Branch and see if there are any extensions that you could use. Either one that creates buttons or an upgraded Pivot Table.
Short of that you could have 3 versions of the pivot table with different sorts and limitations. No buttons in this case. They would see all 3 of them.
- Mark as New
- Bookmark
- Subscribe
- Mute
- Subscribe to RSS Feed
- Permalink
- Report Inappropriate Content
Perhaps, something like this? Click on the link which will take you to the extension for Qlik Sense you might want to use.
- Mark as New
- Bookmark
- Subscribe
- Mute
- Subscribe to RSS Feed
- Permalink
- Report Inappropriate Content
Thank you Mark Ritter & Tereza Gewgorova for your help. If possible can you help me with the exact branch?
- Mark as New
- Bookmark
- Subscribe
- Mute
- Subscribe to RSS Feed
- Permalink
- Report Inappropriate Content
hi can you try something like
create one variable i.e showhide
and 3 buttons
1) top50 and in actions external->setvariable variable:showhide value:1
2)50 to 100 same as above value:2
3)bottom 50 same as above value:3
dimension:Name
1)top 50 sales
expression:=Sum({<Name={"=rank(Sales)<50"}>}Sales)
in layout->conditional: If(showhide=1,1,0)
2) 50 to 100
=Sum({<Name={"=(rank(Sales)>50 and rank(Sales)<=100)"}>}Sales)
in layout->conditional: If(showhide=2,1,0)
3)bottom 50
=Sum({<Name={"=rank(Sales)>50"}>}Sales)
in layout->conditional: If(showhide=3,1,0)
hope this will help
- Mark as New
- Bookmark
- Subscribe
- Mute
- Subscribe to RSS Feed
- Permalink
- Report Inappropriate Content
Here is an example of a button driving the behaviour of a chart by altering a variable. This using the QSVariable extension from Qlik Branch to make it work.
I'm sure you could apply the principle into your pivot table so you wont need multiple charts.
Hope this helps
Andy
- Mark as New
- Bookmark
- Subscribe
- Mute
- Subscribe to RSS Feed
- Permalink
- Report Inappropriate Content
Thank you mahes yadav.. I did the same as you said with little alterations in the data, now i got the required functionality..
- Mark as New
- Bookmark
- Subscribe
- Mute
- Subscribe to RSS Feed
- Permalink
- Report Inappropriate Content
Thanks Andy for your help but am not able to see the button visualisation in the file which you have shared with me neither it's not working in Qliksense Desktop nor in Qliksense server. !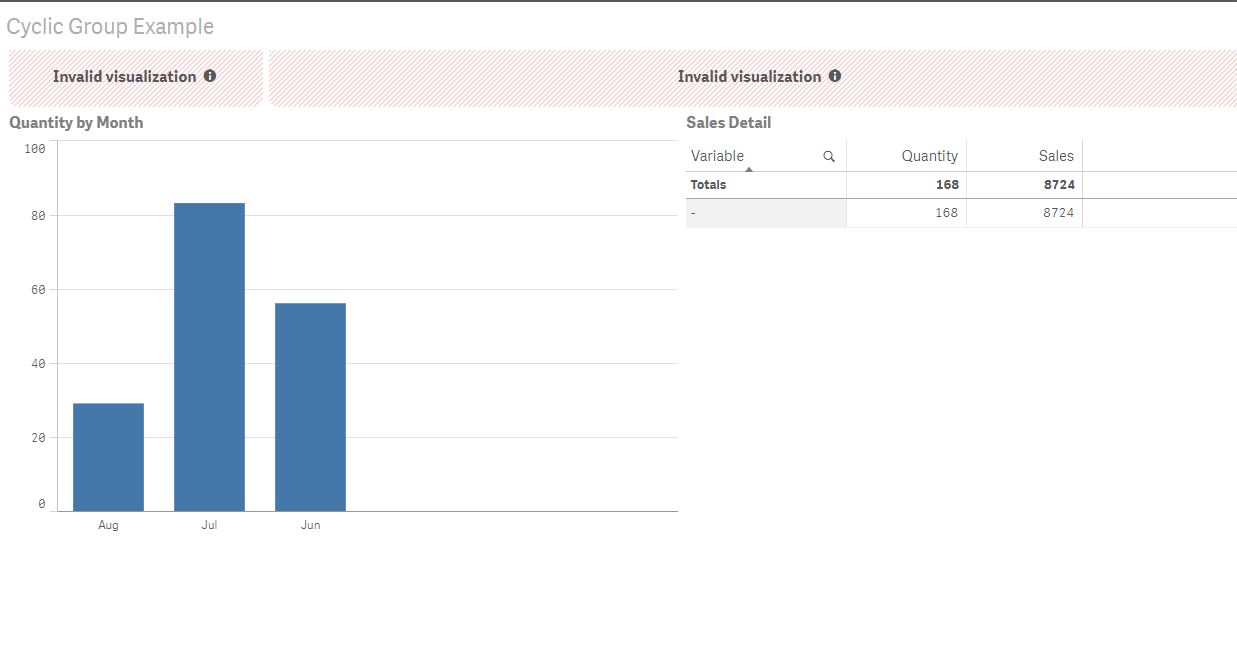
- Mark as New
- Bookmark
- Subscribe
- Mute
- Subscribe to RSS Feed
- Permalink
- Report Inappropriate Content
you would need to install the QsVariable extension on your desktop for the visualisation to display. then you would have a working example of what you need.