Unlock a world of possibilities! Login now and discover the exclusive benefits awaiting you.
- Qlik Community
- :
- Forums
- :
- Analytics
- :
- New to Qlik Analytics
- :
- Points not displaying on map
- Subscribe to RSS Feed
- Mark Topic as New
- Mark Topic as Read
- Float this Topic for Current User
- Bookmark
- Subscribe
- Mute
- Printer Friendly Page
- Mark as New
- Bookmark
- Subscribe
- Mute
- Subscribe to RSS Feed
- Permalink
- Report Inappropriate Content
Points not displaying on map
Hi there,
I've created a measure which I can display in a text field. The measure just counts according to the following expression:
Count({<EQUIP_GRP_ID={'MEAE'},
EQUIP_CLASSIF_2={'ME'},
WO_STATUS_M={'C'},
STD_JOB_NO={'010552', '010553', '010554', '010555', '010556'},
EQUIP_STATUS={'OU'}>}
WORK_GROUP)
The measure is linked via the data to a site name and geocodepoint from the site lat-long.
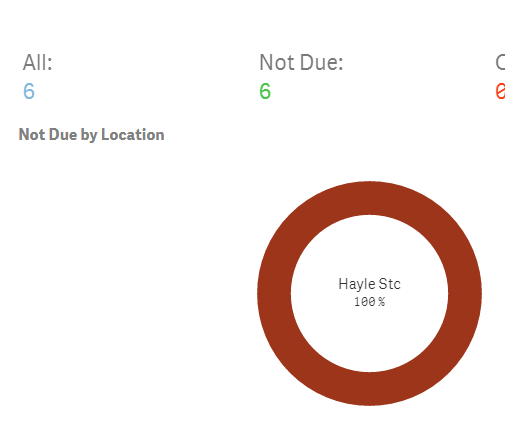
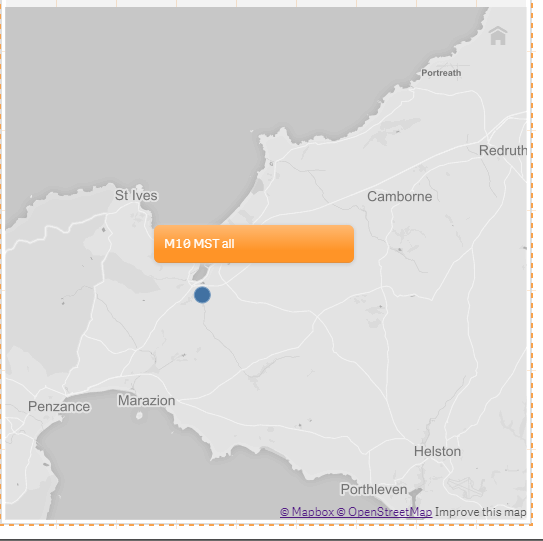
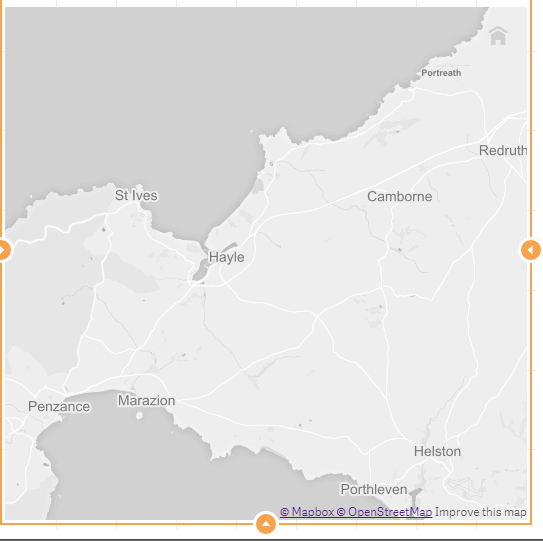
The dimension shows on a map perfectly well:
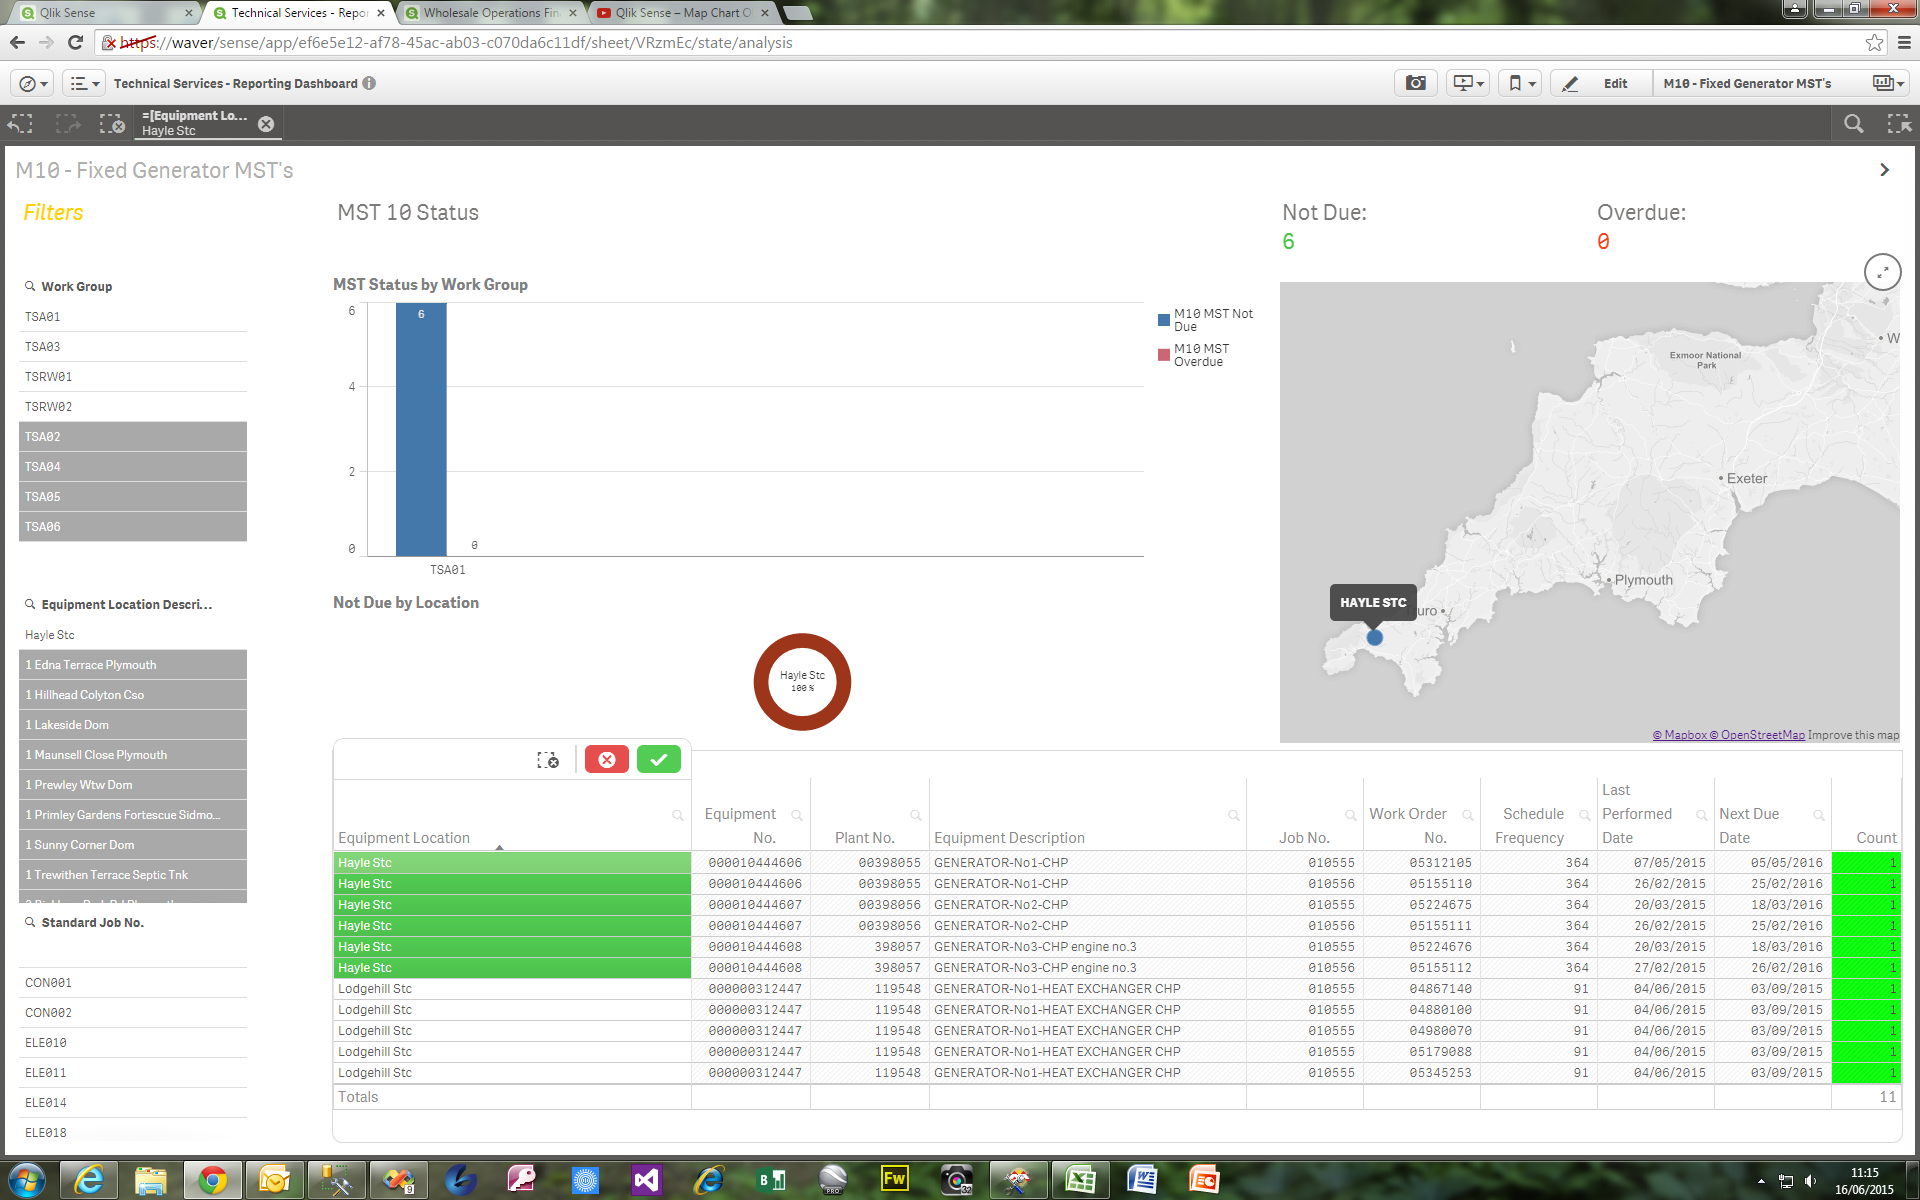
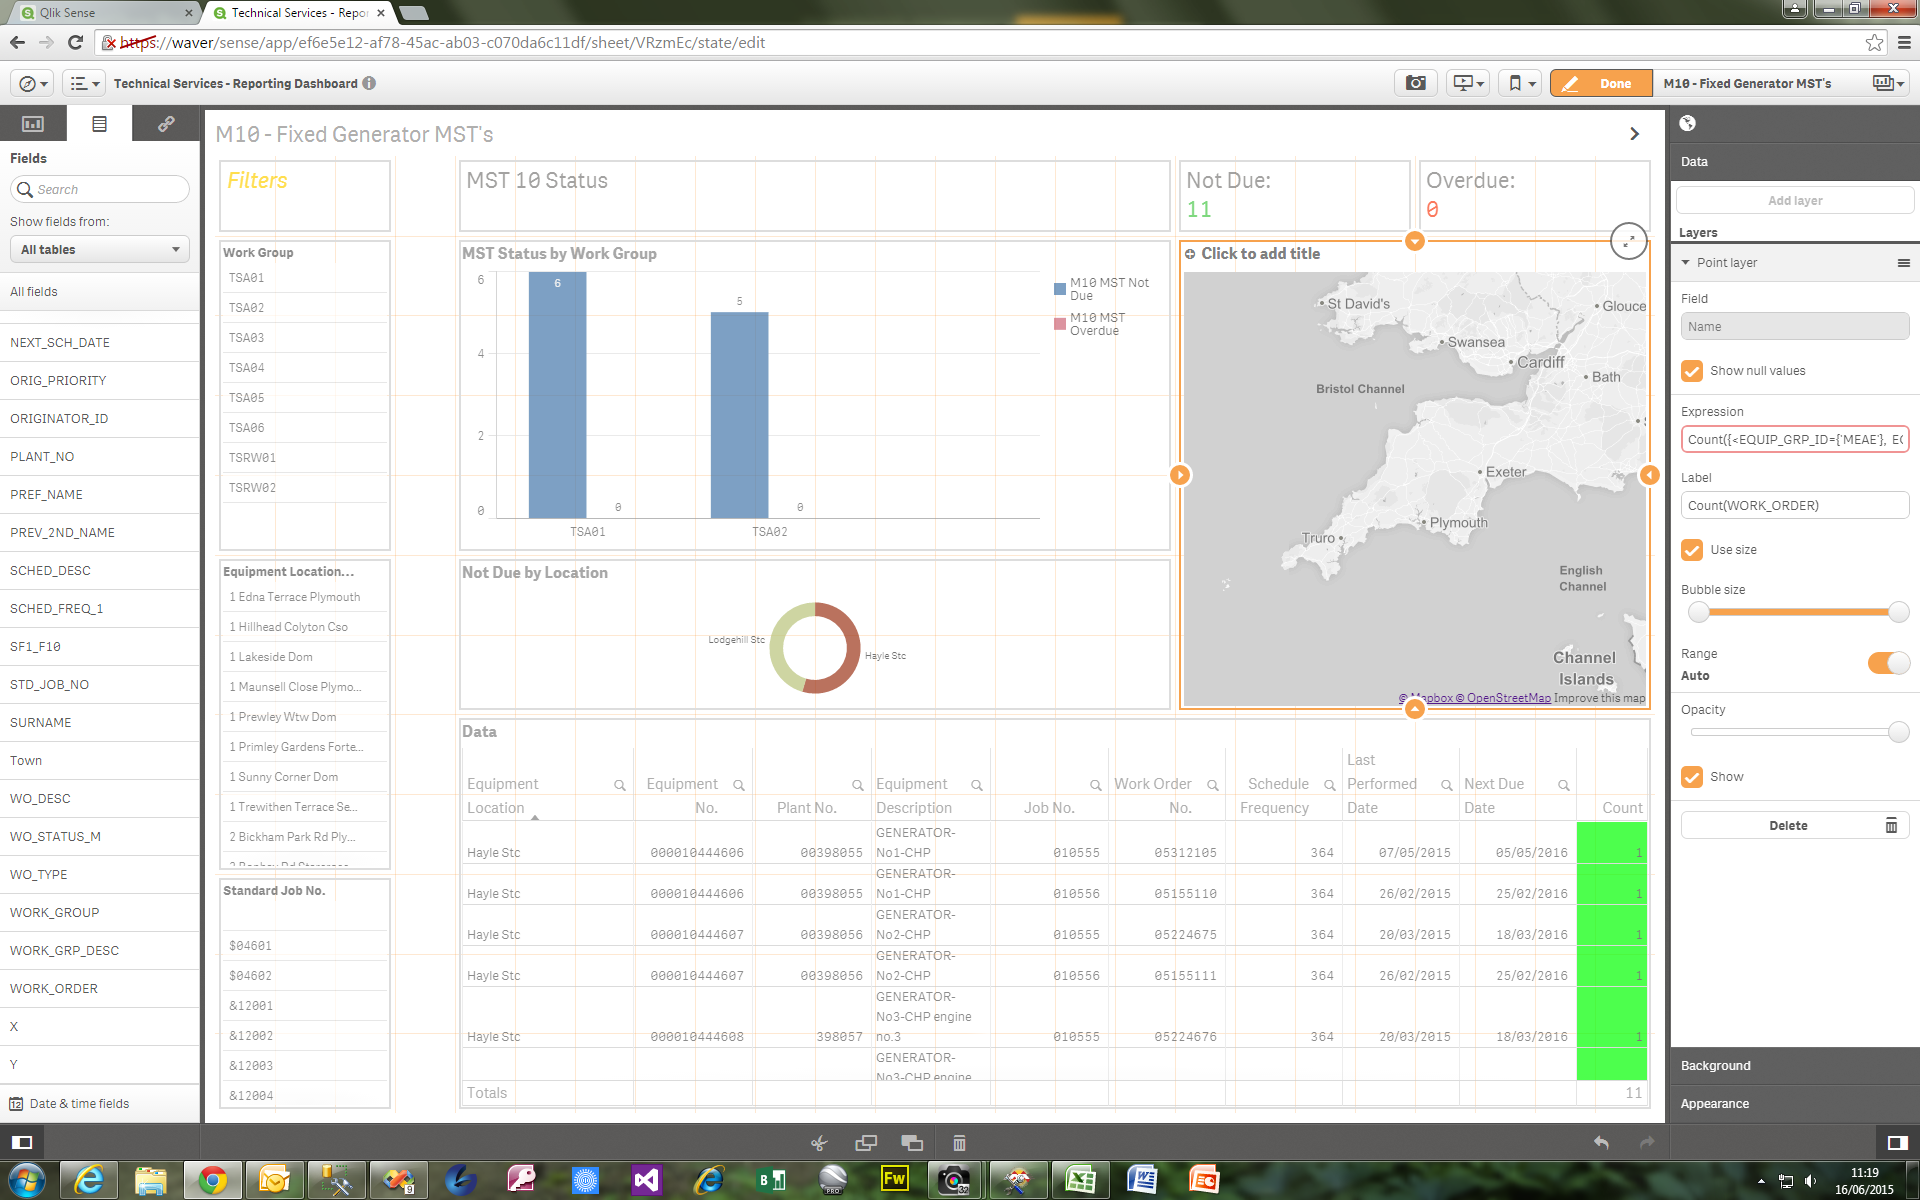
But when I add the measure, the points disappear:
Any idea what I am doing wrong?
Thanks
Neil
- Tags:
- map
- point
- qlik sense
Accepted Solutions
- Mark as New
- Bookmark
- Subscribe
- Mute
- Subscribe to RSS Feed
- Permalink
- Report Inappropriate Content
So, in this case, Equipment Location = Equipment Location Description from EquipmentLocation dimension.
Could you add the EQUIP_LOCATION and EQUIP_NO keys to the table?
And maybe send your .qvf, so we can analyse it faster?
- Mark as New
- Bookmark
- Subscribe
- Mute
- Subscribe to RSS Feed
- Permalink
- Report Inappropriate Content
Hello,
Could you please show the expression result before and after you add the measure to the map?
Thanks,
Estela
- Mark as New
- Bookmark
- Subscribe
- Mute
- Subscribe to RSS Feed
- Permalink
- Report Inappropriate Content
Have you tried making the Bubble size bigger by sliding the slider?
I don't see an issue unless your metric has a Zero output.
- Mark as New
- Bookmark
- Subscribe
- Mute
- Subscribe to RSS Feed
- Permalink
- Report Inappropriate Content
Hi there,
The points - which are site locations - are added to the map correctly:
The measure which creates a count:
Count({<EQUIP_GRP_ID={'MEAE'},
EQUIP_CLASSIF_2={'ME'},
WO_STATUS_M={'C'},
STD_JOB_NO={'010552', '010553', '010554', '010555', '010556'},
EQUIP_STATUS={'OU'}>}
WORK_GROUP)
generates a numerical output which I have displayed in a chart and a text box:
But when this measure is dropped onto the map the points disappear. They are not just very small, they are just not there:
This isn't the first issue I've had with the map not displaying the results of set analysis expression with more than an couple of metrics.
Neil
- Mark as New
- Bookmark
- Subscribe
- Mute
- Subscribe to RSS Feed
- Permalink
- Report Inappropriate Content
Hello,
I have made some tests and it seems like if you forget to link your tables at any point, mainly in a field that connects to your geolocation info, it may show the measure value in a chart or text field according to the expression, but it will not show on the map.
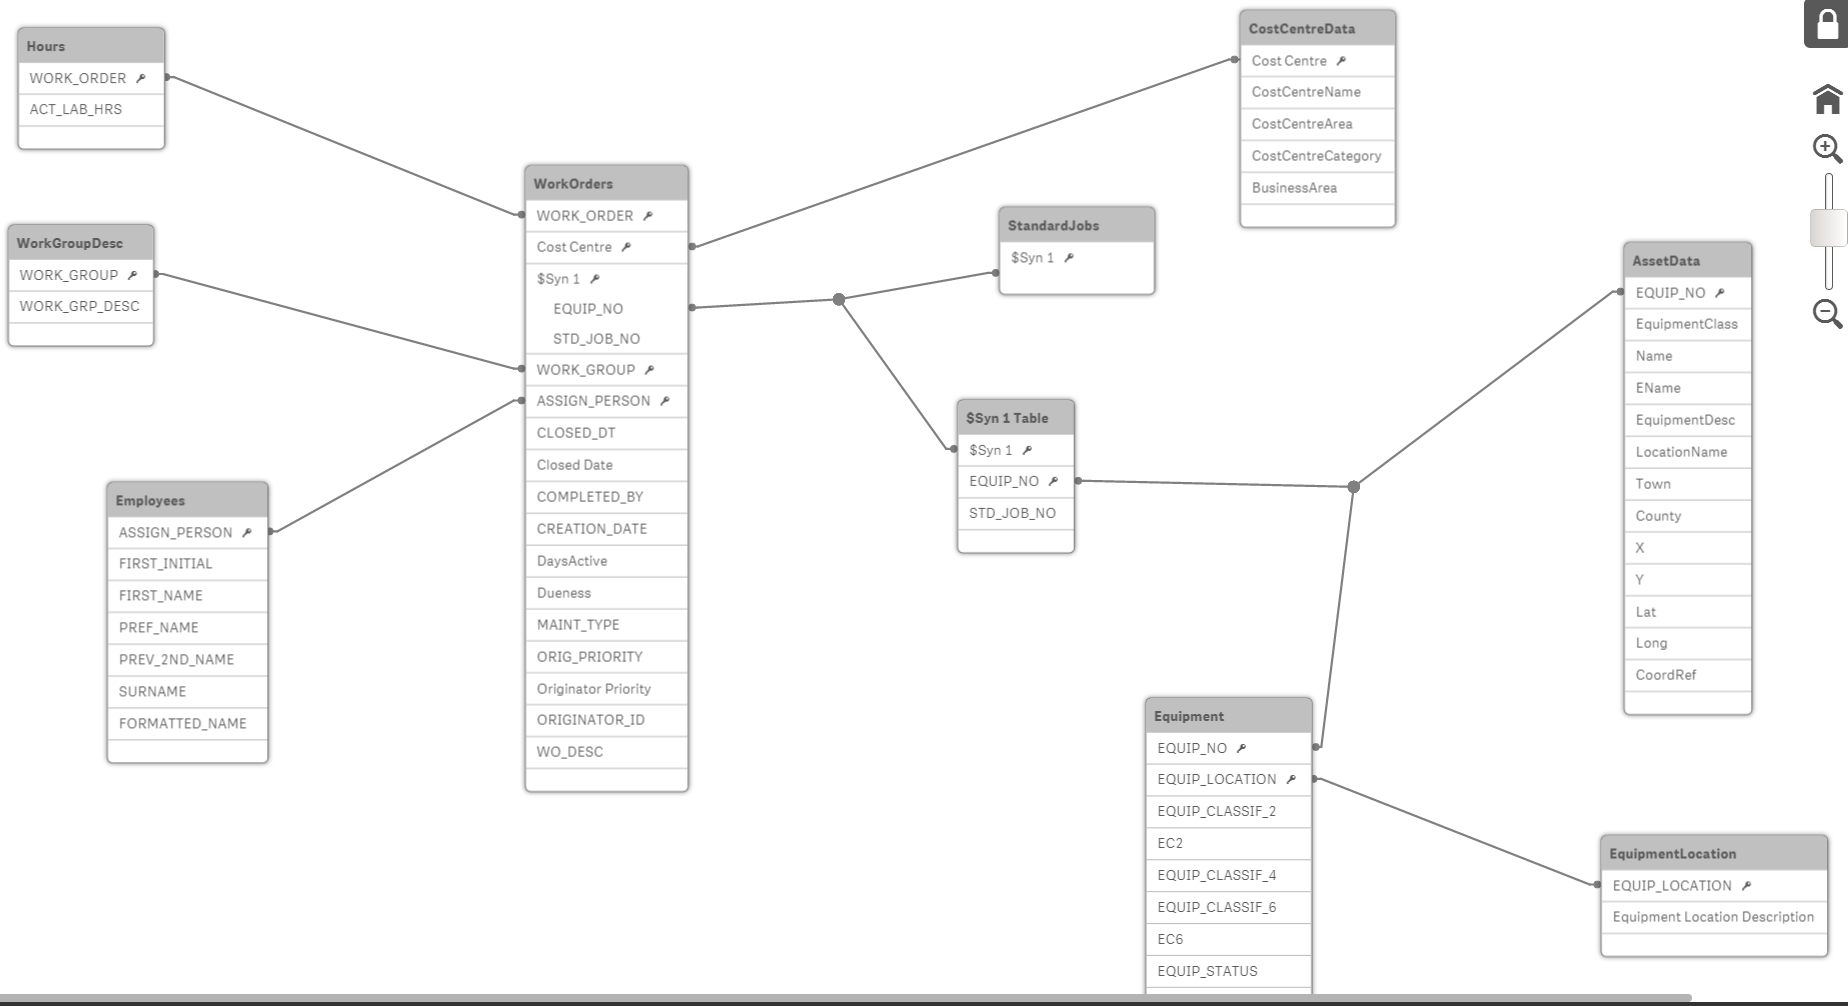
Could you show your data model?
Thanks,
Estela
- Mark as New
- Bookmark
- Subscribe
- Mute
- Subscribe to RSS Feed
- Permalink
- Report Inappropriate Content
Is that possible to share your QVF? and what version are you on 1.0,x? or 1.1?
- Mark as New
- Bookmark
- Subscribe
- Mute
- Subscribe to RSS Feed
- Permalink
- Report Inappropriate Content
Hi both,
It must be to do with my data model. Everything is connected, tho there is a synthetic key as I need two columns from two tables to be joined to each other:
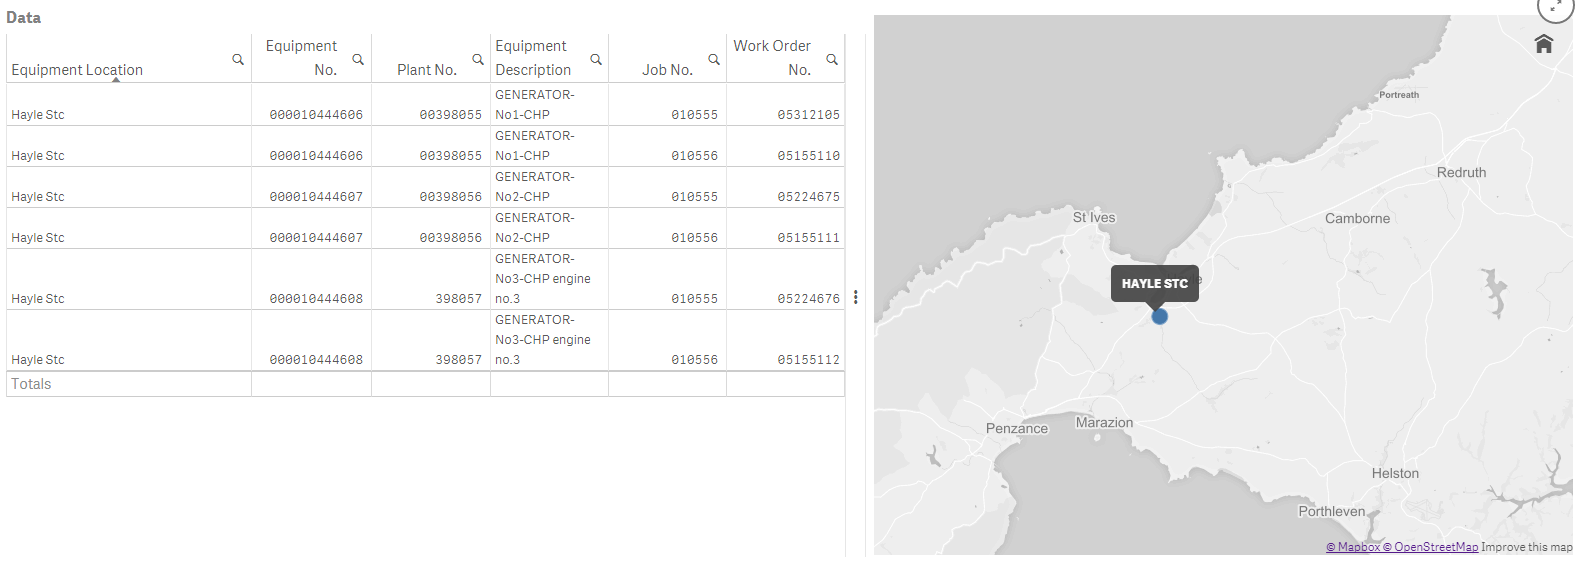
When I add the co ordinates to a table (they are shown as x-y but the geocoord point is lat-long), they display without the count, (altho twice - which makes me think its the data model) but not with it:
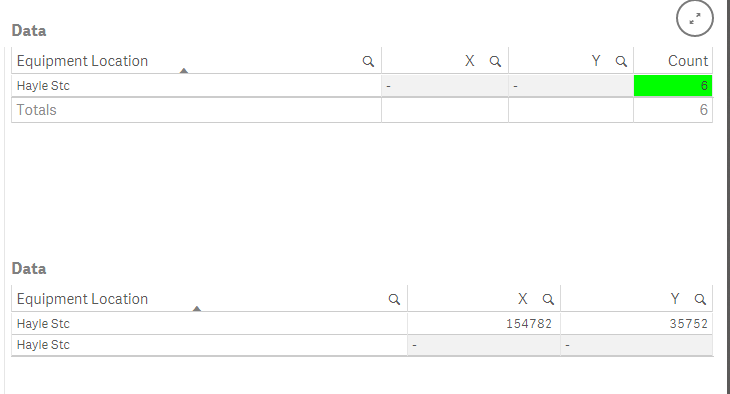
Think its the fact the site is appearing twice that is causing the issue...
I'm on Sense 1.1 by the way!
- Mark as New
- Bookmark
- Subscribe
- Mute
- Subscribe to RSS Feed
- Permalink
- Report Inappropriate Content
So, in this case, Equipment Location = Equipment Location Description from EquipmentLocation dimension.
Could you add the EQUIP_LOCATION and EQUIP_NO keys to the table?
And maybe send your .qvf, so we can analyse it faster?
- Mark as New
- Bookmark
- Subscribe
- Mute
- Subscribe to RSS Feed
- Permalink
- Report Inappropriate Content
Hi Estela & Phaneendra,
Sorry for the late reply. Once I had joined my data model on the EQUIP_LOCATION then everything worked fine.
The problem here was at every EQUIP_NO associated to a EQUIP_LOCATION was different, an so needed this common field to work correctly. Obvious now!
Thanks both for all your help!
Neil