Unlock a world of possibilities! Login now and discover the exclusive benefits awaiting you.
- Qlik Community
- :
- Forums
- :
- Analytics
- :
- New to Qlik Analytics
- :
- Poor data structure???
- Subscribe to RSS Feed
- Mark Topic as New
- Mark Topic as Read
- Float this Topic for Current User
- Bookmark
- Subscribe
- Mute
- Printer Friendly Page
- Mark as New
- Bookmark
- Subscribe
- Mute
- Subscribe to RSS Feed
- Permalink
- Report Inappropriate Content
Poor data structure???
Hi everyone,
I'm pulling my hair out with this one. Do I have poorly arranged data, can I really do what I want it to do???
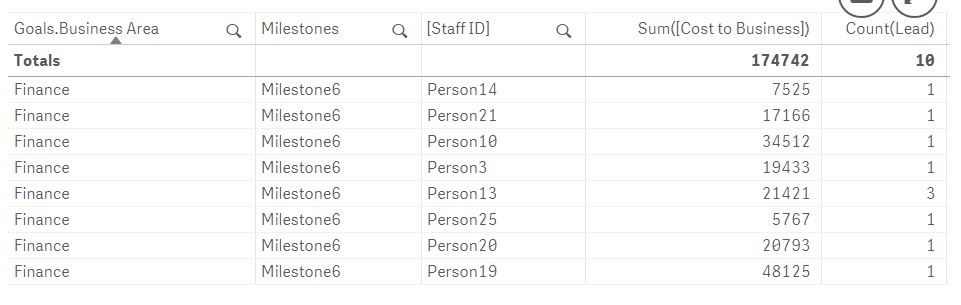
Here's a look at the data structure

And here's the viz...
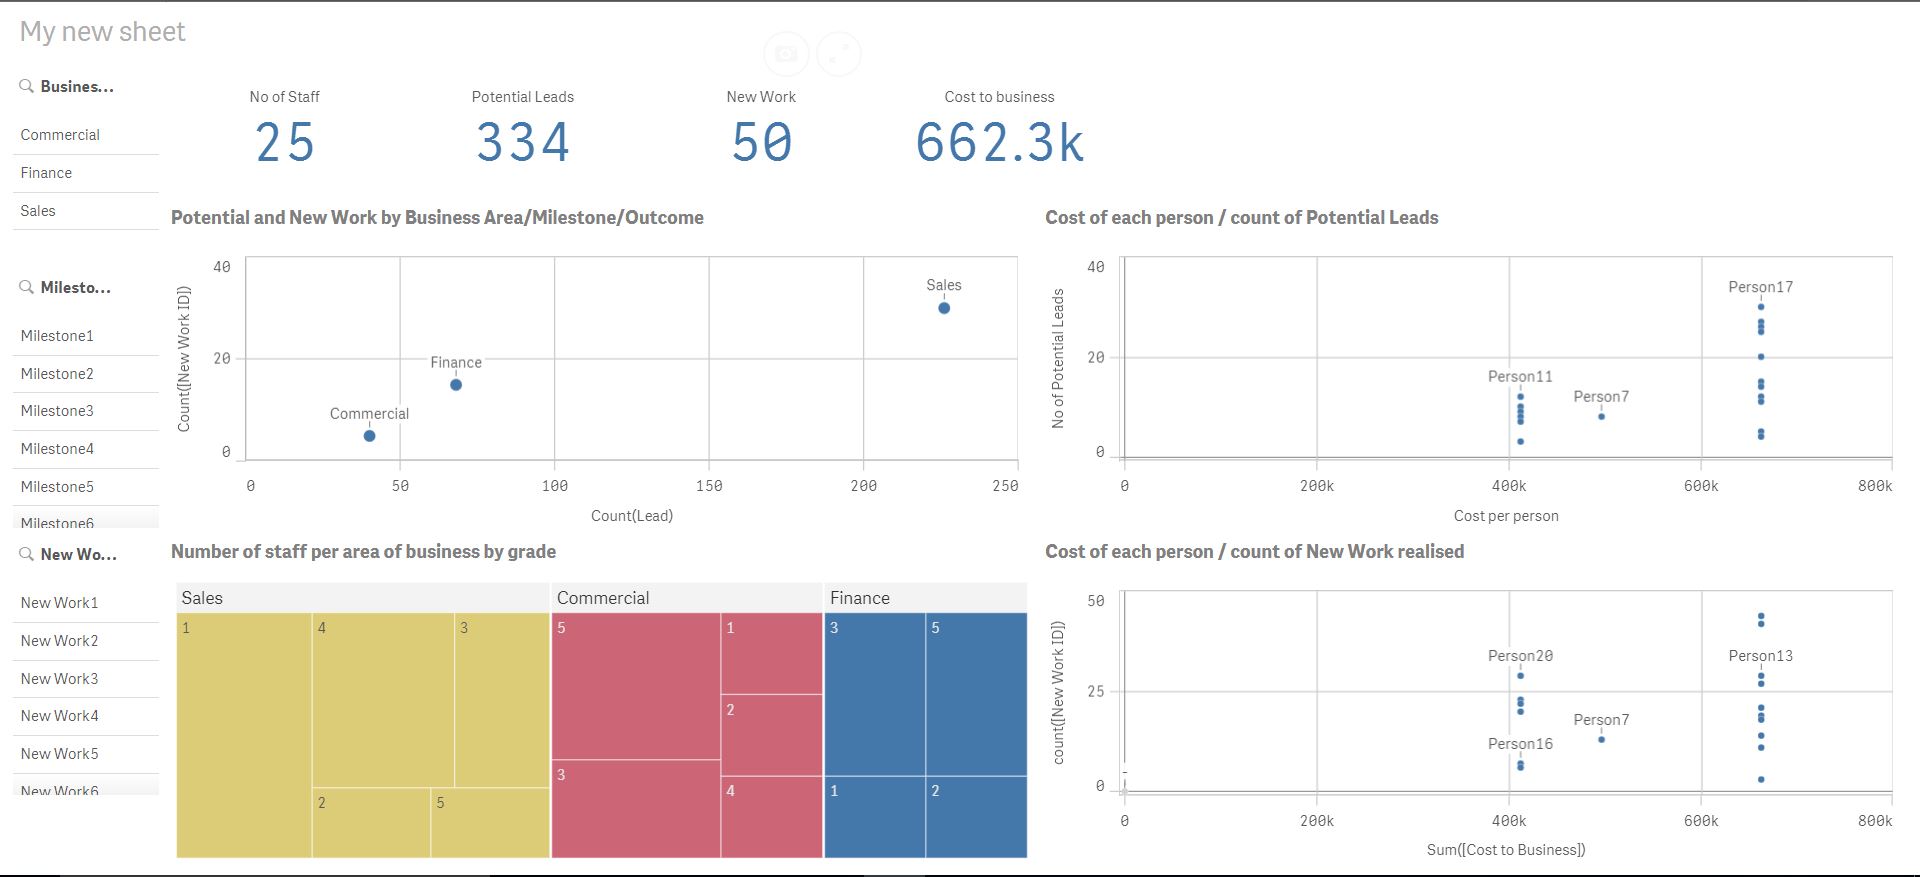
The top left scatter is using a drill down dimension of Business Area>Milestones>Outcomes, when I select one of them, I'm hoping to see the scatter plots on the right update with the amount of leads and new work the associated staff have generated, as you can see this doesn't seem to work as planned (the summing of their 'cost to business' is very wrong). Potential Leads and New Work are assigned to the Milestones that they contribute towards.
I've attached the .qvf if any of you good people could spend a few minutes looking at it and see where I'm going wrong please???
Many thanks,
Leo
- Mark as New
- Bookmark
- Subscribe
- Mute
- Subscribe to RSS Feed
- Permalink
- Report Inappropriate Content
Can you give us a selection criteria, and what is should be? For instance, tell us {Business Area = Finance} the Sum(Cost To Business) should = 100. Generally, when I have an issue like this, I will make a straight table and where I can see all my Sum totals and all the dimensions that are available.

- Mark as New
- Bookmark
- Subscribe
- Mute
- Subscribe to RSS Feed
- Permalink
- Report Inappropriate Content
Hi Justin,
So what should happen is as follows:
When I select finance on the top left scatter, the scatters to the right will update to show me only the people in that area of the business, the x axis will show their individual cost to business (i.e. salary) and the y axis shows me how many potential leads they have produced. I can get this to work when I change the data association as shown below, but then the bottom left tree map doesn't work...

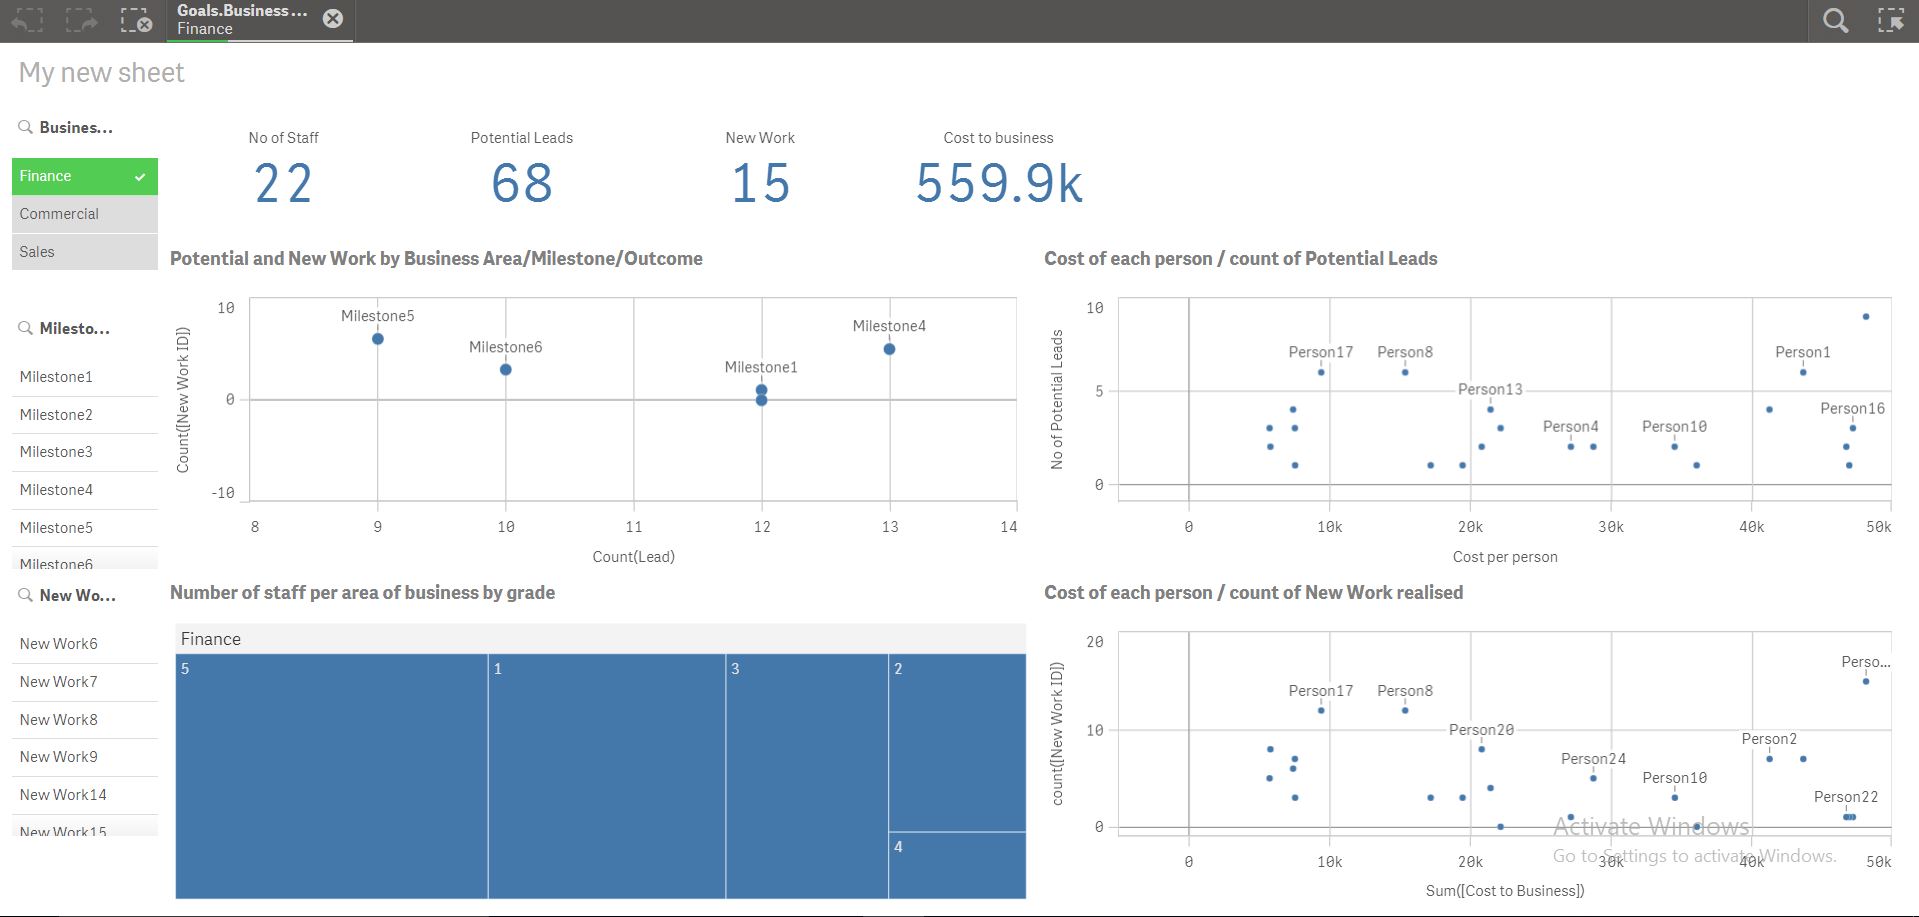
either way I associate the data I get part of it working, but not the other.
Below is an example of what i'm after, but can only obtain this once I've changed the data associations as above (but as mentioned, this then breaks the tree map).
Any ideas???
- Mark as New
- Bookmark
- Subscribe
- Mute
- Subscribe to RSS Feed
- Permalink
- Report Inappropriate Content
Not sure but it could be because you are treating staff ID in different tables as different business names. What if you associate your staff IDs instead of business areas or milestones. What if you join Goals, Financials and potential leads tables and keep staff Id/milestones as the main keys of association.