Unlock a world of possibilities! Login now and discover the exclusive benefits awaiting you.
- Qlik Community
- :
- Forums
- :
- Analytics
- :
- New to Qlik Analytics
- :
- Re: Prob in Bar Chart in QLiksense
- Subscribe to RSS Feed
- Mark Topic as New
- Mark Topic as Read
- Float this Topic for Current User
- Bookmark
- Subscribe
- Mute
- Printer Friendly Page
- Mark as New
- Bookmark
- Subscribe
- Mute
- Subscribe to RSS Feed
- Permalink
- Report Inappropriate Content
Prob in Bar Chart in QLiksense
Hello All,
In my qliksense, i ahve created a bar chart for Cur Yr and Prev Yr sales. But when i hover on any bar, it is showing other yr value as 0. Can anyone tell em how to suppress this?
Thanks,
Nikhil garg
- « Previous Replies
-
- 1
- 2
- Next Replies »
- Mark as New
- Bookmark
- Subscribe
- Mute
- Subscribe to RSS Feed
- Permalink
- Report Inappropriate Content
Have you included cur Yr sales as another measure? Try that expression and check whether it is giving some value other than 0
- Mark as New
- Bookmark
- Subscribe
- Mute
- Subscribe to RSS Feed
- Permalink
- Report Inappropriate Content
take a copy of chart and
delete one measure and check once and delete other and keep first and see.
and change the chart to straight table and see how the values look like?
- Mark as New
- Bookmark
- Subscribe
- Mute
- Subscribe to RSS Feed
- Permalink
- Report Inappropriate Content
Hi,
Try below ways,
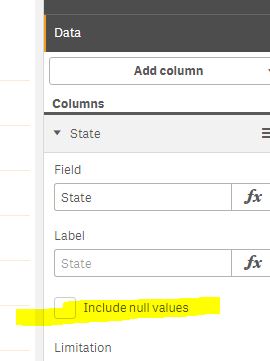
1) suppress null or 0 value from your chart object (fyi, uncheck below check box from your year and measure field)
2) by using set analysis method exclude those Sales 0 year value from chart list
let say example,
for current year sales
sum( {$<Year={"$(=Max(Year))"}, Sales={">0"}>} Sales)
for previous year
sum( {$<Year={"$(=Max(Year)-1)"}, Sales={">0"}>} Sales)
3) if your going to show in your bar always selected year and previous year then just use above two expression.
ThanksDeva
- Mark as New
- Bookmark
- Subscribe
- Mute
- Subscribe to RSS Feed
- Permalink
- Report Inappropriate Content
Hey,
1: Include Null values is already unchecked.
2: Set analysis didnt worked as expected.
Any other way?
- Mark as New
- Bookmark
- Subscribe
- Mute
- Subscribe to RSS Feed
- Permalink
- Report Inappropriate Content
Yes,
I ahve 2 measures:
curYrSales: LEt say value 100
PrevYrSales: Let say value 150
Now, if i hover on prev year, i got to see CurYr =0 and PrevYr = 150
aNd same for curYr. Any solution to this?
- Mark as New
- Bookmark
- Subscribe
- Mute
- Subscribe to RSS Feed
- Permalink
- Report Inappropriate Content
HEy,
Problem is i am using Pivot table. ANd in pivot table, we dont have background color option in dimension
I cann't use straight table because, i ahve to dynamically name my measures as:
1: Sales' $(=Only(Year)-1) and this function will only evaluate in Pivot Table.
ANy other option?
- Mark as New
- Bookmark
- Subscribe
- Mute
- Subscribe to RSS Feed
- Permalink
- Report Inappropriate Content
But, you have mentioned the problem is with hover in bar chart. Right?
How did pivot chart come to picture?
- Mark as New
- Bookmark
- Subscribe
- Mute
- Subscribe to RSS Feed
- Permalink
- Report Inappropriate Content
Hey,
pls ignore my pivot chart reply, that was by mistake 
My problem is with bar chart:
Yes,
I ahve 2 measures:
curYrSales: LEt say value 100
PrevYrSales: Let say value 150
Now, if i hover on prev year, i got to see CurYr =0 and PrevYr = 150
aNd same for curYr. Any solution to this?
- Mark as New
- Bookmark
- Subscribe
- Mute
- Subscribe to RSS Feed
- Permalink
- Report Inappropriate Content
Is it possible to attach sample qvw or measure expressions?
- « Previous Replies
-
- 1
- 2
- Next Replies »