Unlock a world of possibilities! Login now and discover the exclusive benefits awaiting you.
- Qlik Community
- :
- Forums
- :
- Analytics
- :
- New to Qlik Analytics
- :
- Re: Problem with a pivot table
- Subscribe to RSS Feed
- Mark Topic as New
- Mark Topic as Read
- Float this Topic for Current User
- Bookmark
- Subscribe
- Mute
- Printer Friendly Page
- Mark as New
- Bookmark
- Subscribe
- Mute
- Subscribe to RSS Feed
- Permalink
- Report Inappropriate Content
Problem with a pivot table
Hi everybody,
i have a problem with a pivot table:
In the pivot table i have measures in row and dimension in columns.
Measures are for examples: orders quantity , total customers and others, while columns are the selected season (for example summer 2017) and comparison season (in this case summer 2016).
Now i have to insert the differences (numeric and percentage) of the measuser between the two season, and these will be columns.
Is there a way to do this in the pivot table? in case o yes how can i do this?
In case of no how can i solve the problem to insert the differences, i tried with KPI but it's not not very clear.
Thanks in advice
Best regard
Gloria
- Mark as New
- Bookmark
- Subscribe
- Mute
- Subscribe to RSS Feed
- Permalink
- Report Inappropriate Content
Hi Gloria,
You can use the Column() statement to get the difference of what you want.
This statement lets you get the column related measure you want, by using it with an integer, say Column(1) gets the first column of your pivot table.
I have a simple example with two measures and have used the following:
Column(2)-Column(1)
This gets me the following (dummy data):
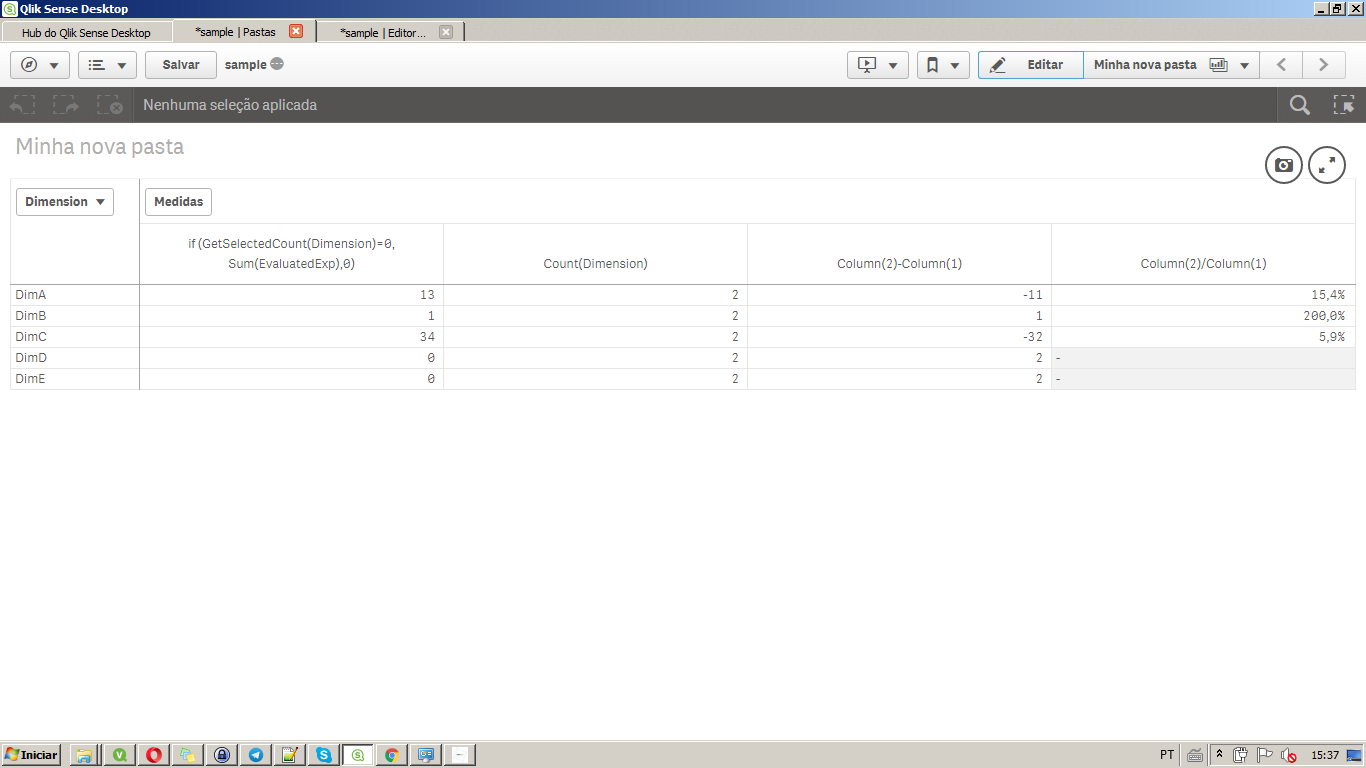
Felipe.
- Mark as New
- Bookmark
- Subscribe
- Mute
- Subscribe to RSS Feed
- Permalink
- Report Inappropriate Content
can you maybe show us an image of what u have and what u excpect to add?
- Mark as New
- Bookmark
- Subscribe
- Mute
- Subscribe to RSS Feed
- Permalink
- Report Inappropriate Content
Hi Gloria,
You can use Set Analysis here.
Eg: Diff. in Order Quantity =
sum({<[season]={'Summer 2017'}>}[orders quantity]) - sum({<[season]={'Summer 2016'}>}[orders quantity])
Let me know if that was helpful! 
- Mark as New
- Bookmark
- Subscribe
- Mute
- Subscribe to RSS Feed
- Permalink
- Report Inappropriate Content
Hi everybody, thanks to all for help, this is what i whant:
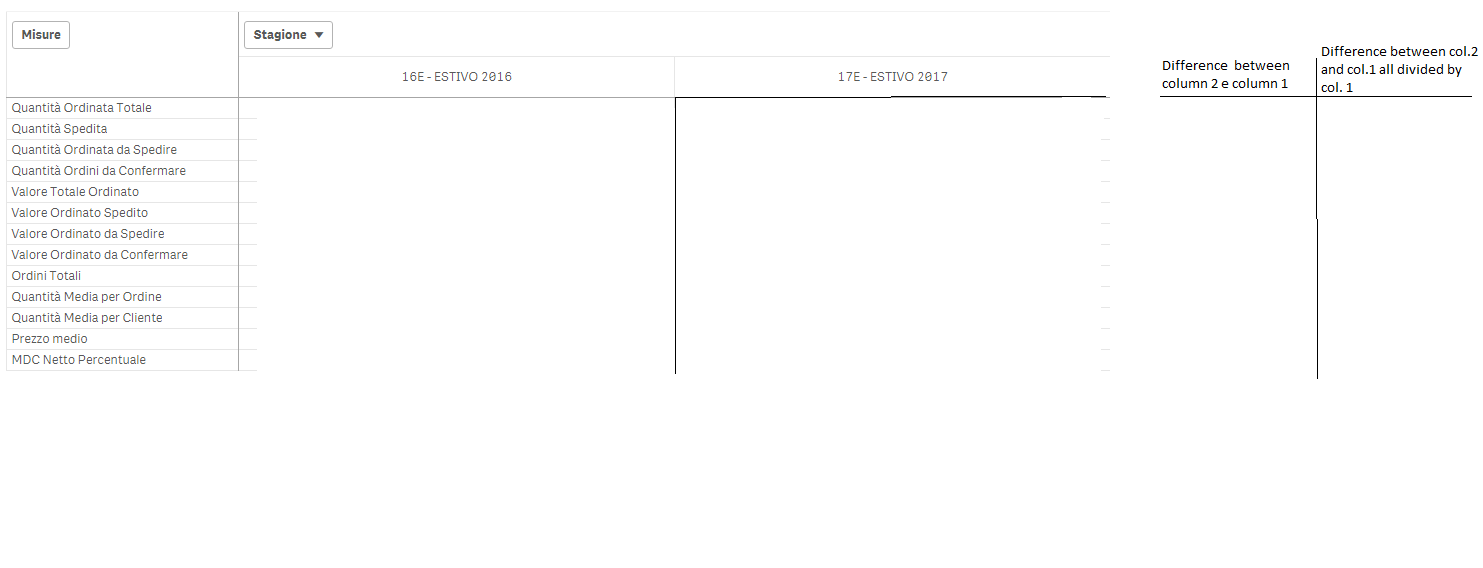
I have the pivot table in the left where: 'misure' are measures while 'stagione' are season.
What i want is to add the two column on right ('difference beetwen col. 2 and col. 1', and 'difference beetwen col. 2 and col. 1 all divided by col.1'), but i don't know if it's possible because these are measures, and as far as i know measures can stay only in columns or in rows.
By Now i solved created all single KPI, but i would like to know if there is another way to solve the problem.
- Mark as New
- Bookmark
- Subscribe
- Mute
- Subscribe to RSS Feed
- Permalink
- Report Inappropriate Content
I think you should follow what adwitiya said above.
First create a variable named "vMisura" as below:
if( Misure = 'Ordini Totali', 'your_field_name_for_order_number',
if( Misure = 'Quantità Spedita', 'your_field_name_for_qta_delivery',
....
for all your dimension values (it seems to be thirtteen)
finally create four measures on your pivot table as below:
sum( {< [season] = {'summer 2016'} >} $(vMisura) )
sum( {< [season] = {'summer 2017'} >} $(vMisura) )
Column(2)-Column(1)
(Column(2)-Column(1)) / Column(1)
I hope it helps.
- Mark as New
- Bookmark
- Subscribe
- Mute
- Subscribe to RSS Feed
- Permalink
- Report Inappropriate Content
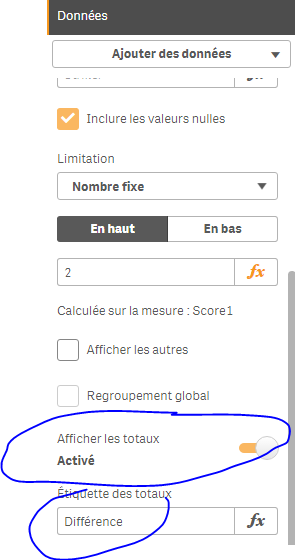
1) Make sure to put your measure as rows and dimension as column
2) Activate the total in ur dimension : Stagione :
per analogy :
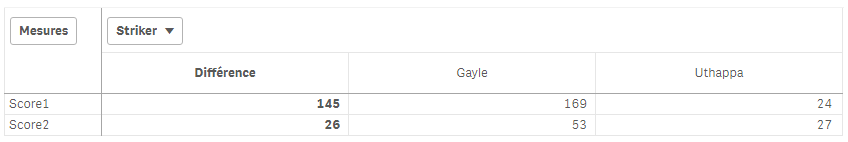
3) in each of your expression; alter it from:
sum(Measure1)
to
if(Dimensionality()=0,sum({<Stagione={'16E - ESTIVO 2017}>}Measure1)-sum({<Stagione={'16E - ESTIVO 2016}>}Measure1) , sum(Measure1))
sum(Measure2)
to
if(Dimensionality()=0,sum({<Stagione={'16E - ESTIVO 2017}>}Measure1)-sum({<Stagione={'16E - ESTIVO 2016}>}Measure1) , sum(Measure2))
sum(Measure3)
to
if(Dimensionality()=0,sum({<Stagione={'16E - ESTIVO 2017}>}Measure1)-sum({<Stagione={'16E - ESTIVO 2016}>}Measure1) , sum(Measure3))
sum(Measure4)
to
if(Dimensionality()=0,sum({<Stagione={'16E - ESTIVO 2017}>}Measure1)-sum({<Stagione={'16E - ESTIVO 2016}>}Measure1) , sum(Measure4))
and so on..
AND PLEASE MAKE SUR TO WRITE THE VALUES OF UR DIMENSION EXACTLY AS THEY ARE .
Qlik is case sensitive
Result (per analogy)
- Mark as New
- Bookmark
- Subscribe
- Mute
- Subscribe to RSS Feed
- Permalink
- Report Inappropriate Content
Hi,
sampledata:
load * Inline [
YEAR,VALUE1,VALUE2,VALUE3
2010,300,100,50
2010,400,250,25
2010,200,140,70
2011,700,400,300
2011,500,200,300
2011,600,450,170
];
create a variable named 'vColumnList':
ValueList('2010','2011','Diff','Ratio')
Add Pivot Table to your sheet:
Column :
$(vColumnList)
Measure1(Value1) :
pick(Match(ValueList('2010','2011','Diff','Ratio'),'2010','2011','Diff','Ratio'),
sum({<YEAR={2010}>}VALUE1),
sum({<YEAR={2011}>}VALUE1),
sum({<YEAR={2011}>}VALUE1)-sum({<YEAR={2010}>}VALUE1),
num((sum({<YEAR={2011}>}VALUE1)-sum({<YEAR={2010}>}VALUE1))/sum({<YEAR={2011}>}VALUE1),'#,##%')
)
Measure2:
pick(Match(ValueList('2010','2011','Diff','Ratio'),'2010','2011','Diff','Ratio'),
sum({<YEAR={2010}>}VALUE2),
sum({<YEAR={2011}>}VALUE2),
sum({<YEAR={2011}>}VALUE2)-sum({<YEAR={2010}>}VALUE2),
num((sum({<YEAR={2011}>}VALUE2)-sum({<YEAR={2010}>}VALUE2))/sum({<YEAR={2011}>}VALUE2),'#,##%')
)
Measure3:
pick(Match(ValueList('2010','2011','Diff','Ratio'),'2010','2011','Diff','Ratio'),
sum({<YEAR={2010}>}VALUE3),
sum({<YEAR={2011}>}VALUE3),
sum({<YEAR={2011}>}VALUE3)-sum({<YEAR={2010}>}VALUE3),
num((sum({<YEAR={2011}>}VALUE3)-sum({<YEAR={2010}>}VALUE3))/sum({<YEAR={2011}>}VALUE3),'#,##%')
)
You can edit the expressions to work for your data model.
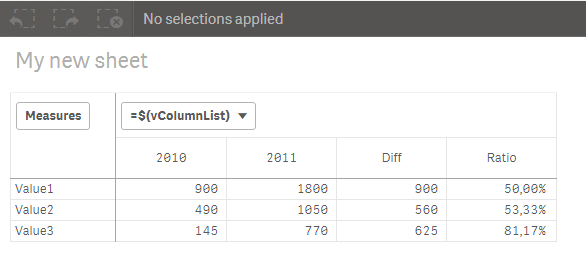
Hope it helps..
- Mark as New
- Bookmark
- Subscribe
- Mute
- Subscribe to RSS Feed
- Permalink
- Report Inappropriate Content
thanks a lot to everyone for the help.
As soon as i can i'll try all the differents solutions
Good day to all