Unlock a world of possibilities! Login now and discover the exclusive benefits awaiting you.
- Qlik Community
- :
- Forums
- :
- Analytics
- :
- New to Qlik Analytics
- :
- Qlik - Count values from daily files, and pair the...
- Subscribe to RSS Feed
- Mark Topic as New
- Mark Topic as Read
- Float this Topic for Current User
- Bookmark
- Subscribe
- Mute
- Printer Friendly Page
- Mark as New
- Bookmark
- Subscribe
- Mute
- Subscribe to RSS Feed
- Permalink
- Report Inappropriate Content
Qlik - Count values from daily files, and pair them with file date for historical charts
Hi everybody.
I have a folder that is filled with files that are updated every day with a new file.
The file name could be
02-12-2017_billing.qvd
03-12-2017_billing.qvd
04-12-2017_billing.qvd
05-12-2017_billing.qvd
... and so on up till today´s date.
I need to make my backend scripting able to take the date from the filename, then count a specific set of values in the file, put the date and count together.
Let me clarify.
I am to use this dates to compare the difference between values in the files for each day/week/month/year.
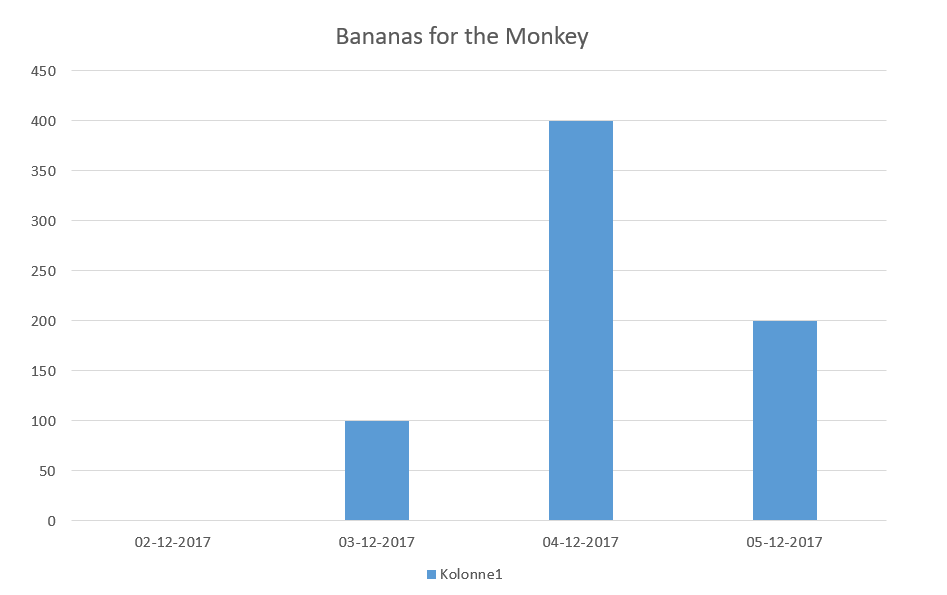
Say I have a count of Bananas  in the files. I would like to know how many Bananas are the difference is between every file according to the data.
02-12-2017_billing.qvd count(Banana) = 1000
03-12-2017_billing.qvd count(Banana) = 900 (Bananas eaten since yesterday = 100)
04-12-2017_billing.qvd count(Banana) = 500 (Bananas eaten since yesterday = 400)
05-12-2017_billing.qvd count(Banana) = 300 (Bananas eaten since yesterday = 200)
In a chart, I would then on a daily basis know how many bananas were eaten since the day before (or week/month/year depending on what I need to see)
Like this example...
This, of course, need to be dynamic in a sort so this would work on all previous files, and files to come.
Accepted Solutions
- Mark as New
- Bookmark
- Subscribe
- Mute
- Subscribe to RSS Feed
- Permalink
- Report Inappropriate Content
Tried something similar to vamsee by doing with some test QVD the following:
Having the files:
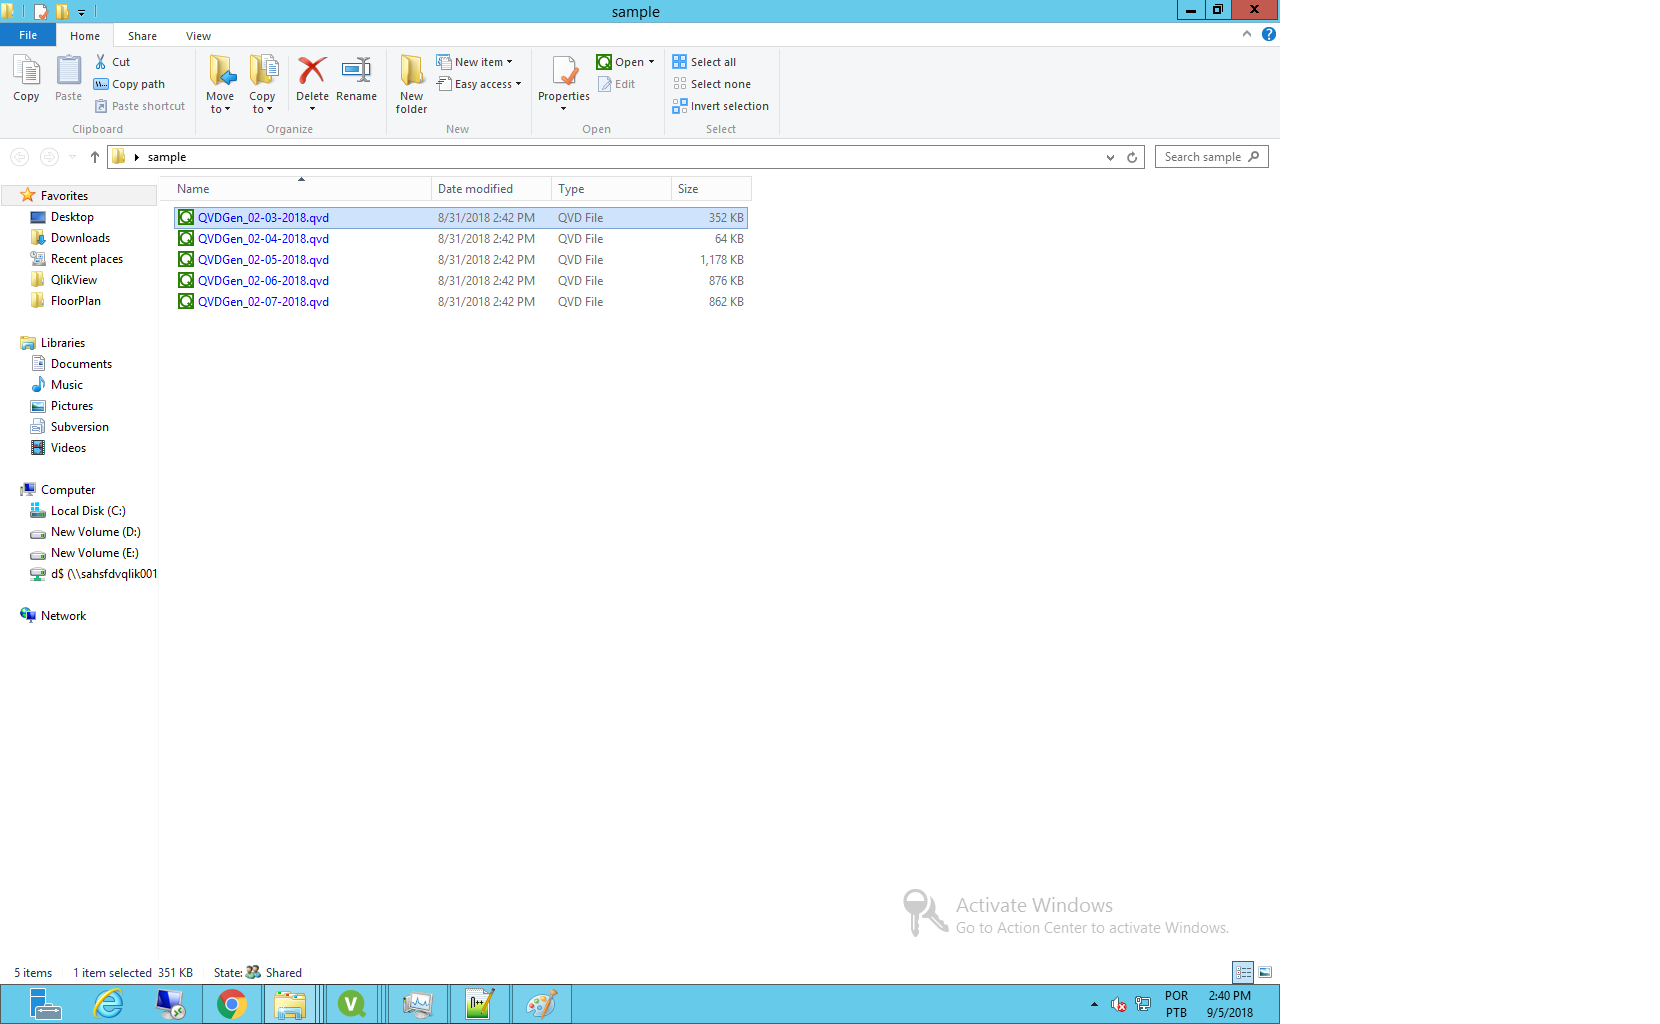
_tmpData:
LOAD
Id,
    Test,
    Value,
    FileName() as [File Name]
FROM

(qvd);

Data:
Load *,
    date#(subfield(subfield([File Name],'_',2),'.qvd',1),'MM-DD-YYYY') as [File Date]
Resident _tmpData;

drop table _tmpData;

_tmpCount:
Load
[File Date],
sum(Value) as [Sum of Value]
Resident Data
where
[$(fieldName)] = '$(fieldValue)'
group by
[File Date];
Where I have fieldName and fieldValue as variables.
Gets me the following:
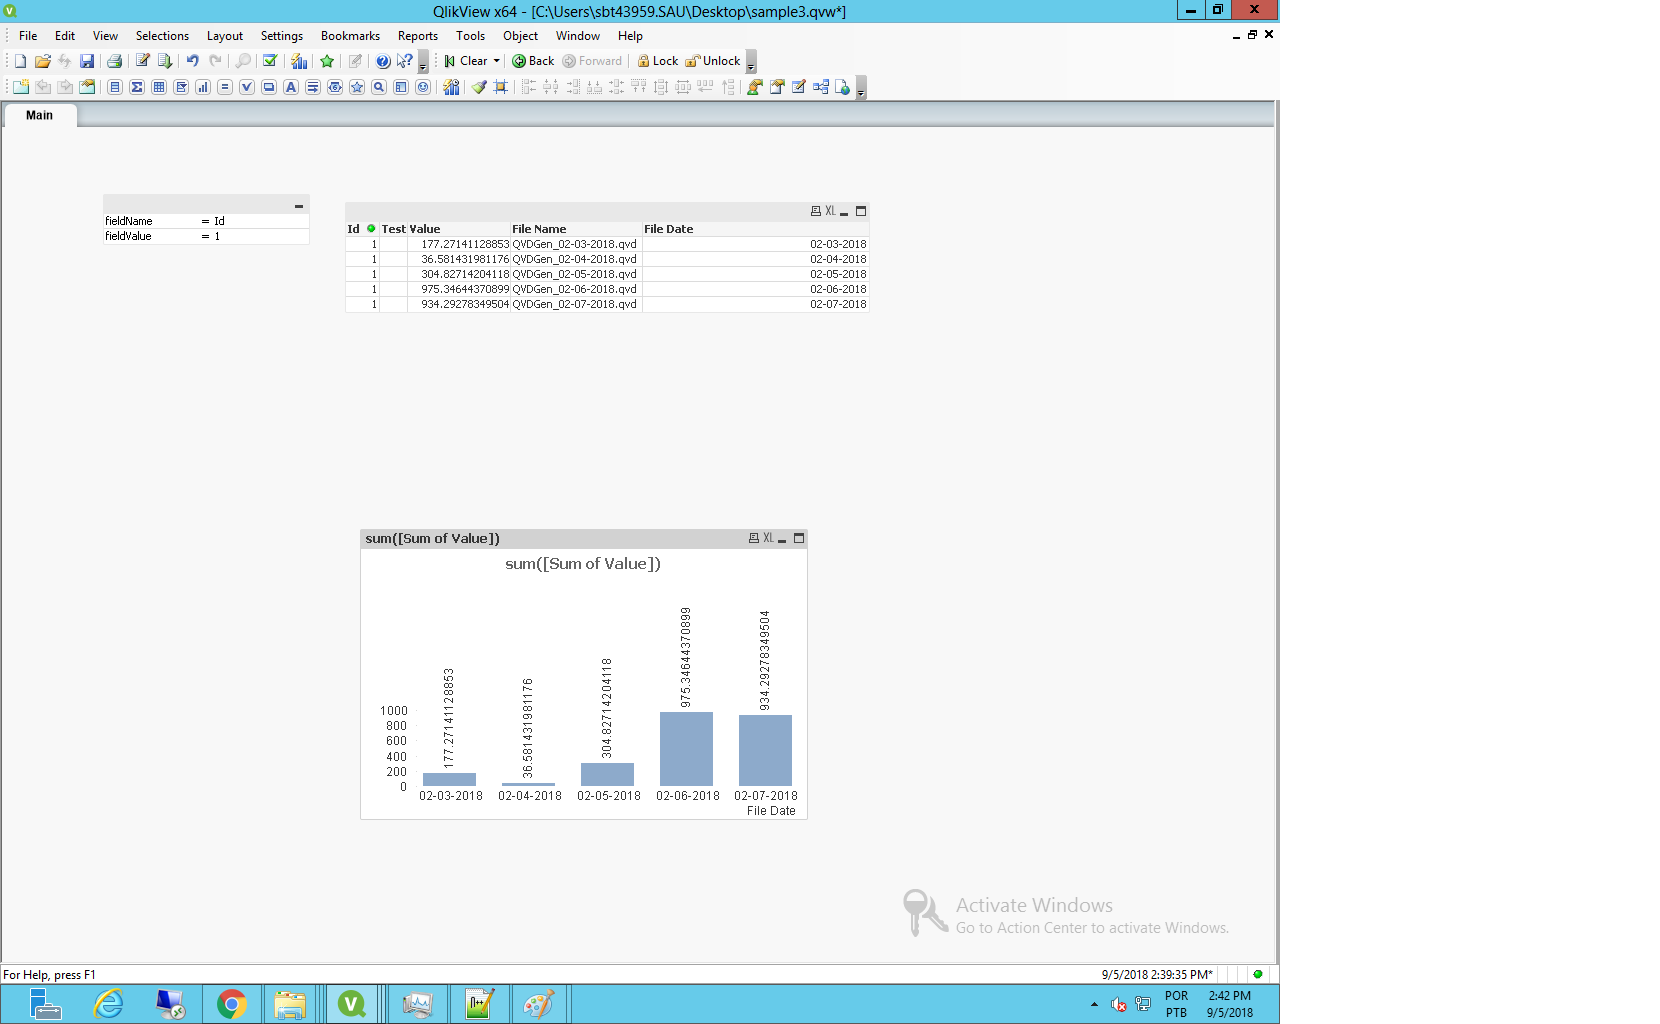
Attached the QVW and QVDs used.
- Mark as New
- Bookmark
- Subscribe
- Mute
- Subscribe to RSS Feed
- Permalink
- Report Inappropriate Content
Hi Daniel,
May be try this
Source:
LOAD
Column, /* Bananas*/
Date(Date#(SubField(FileName(),'_',1), 'MM-DD-YYYY')) as Date
FROM
[*_billing.qvd]
(qvd);
Temp:
Left Join(Source)
LOAD
Count(DISTINCT Column) as Count,
Date
Resident Source
Group By Date;
Transformed:
LOAD Distinct
Date,
Previous(Count)-Count as Consumed
Resident Source;
- Mark as New
- Bookmark
- Subscribe
- Mute
- Subscribe to RSS Feed
- Permalink
- Report Inappropriate Content
Tried something similar to vamsee by doing with some test QVD the following:
Having the files:
_tmpData:
LOAD
Id,
    Test,
    Value,
    FileName() as [File Name]
FROM

(qvd);

Data:
Load *,
    date#(subfield(subfield([File Name],'_',2),'.qvd',1),'MM-DD-YYYY') as [File Date]
Resident _tmpData;

drop table _tmpData;

_tmpCount:
Load
[File Date],
sum(Value) as [Sum of Value]
Resident Data
where
[$(fieldName)] = '$(fieldValue)'
group by
[File Date];
Where I have fieldName and fieldValue as variables.
Gets me the following:
Attached the QVW and QVDs used.
- Mark as New
- Bookmark
- Subscribe
- Mute
- Subscribe to RSS Feed
- Permalink
- Report Inappropriate Content
Hi Felip and Vamsee
Both are correct, work like a charm (thx btw)
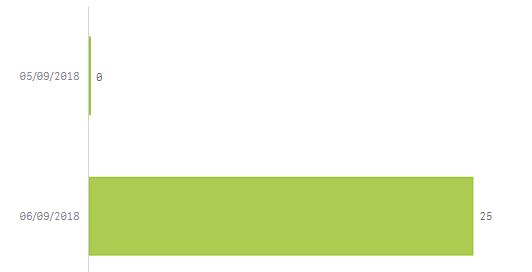
The only problem I have now is that the consumed bananas are shown on the date for which the difference comes from. (I think I might have left that part out)
It now looks like that the 25 bananas consumed, were consumed today? I would like if the value 25 were on 05/09/2018 instead of 06/09/2018 because like this, then it looks like 0 were consumed on 05/09/2018 and this was not the case.
(Maybe the banana terminology has gone too far? )
- Mark as New
- Bookmark
- Subscribe
- Mute
- Subscribe to RSS Feed
- Permalink
- Report Inappropriate Content
Hi Daniel,
On my example, you could do the following with the expression:
if
(
RowNo()=1,
sum([Sum of Value]),
sum([Sum of Value])-above(sum([Sum of Value]))
)
So, the RowNo() gets me the first value to be the sum of bananas and the rest of them, the difference between the sum and the previous value.
It gets me the result
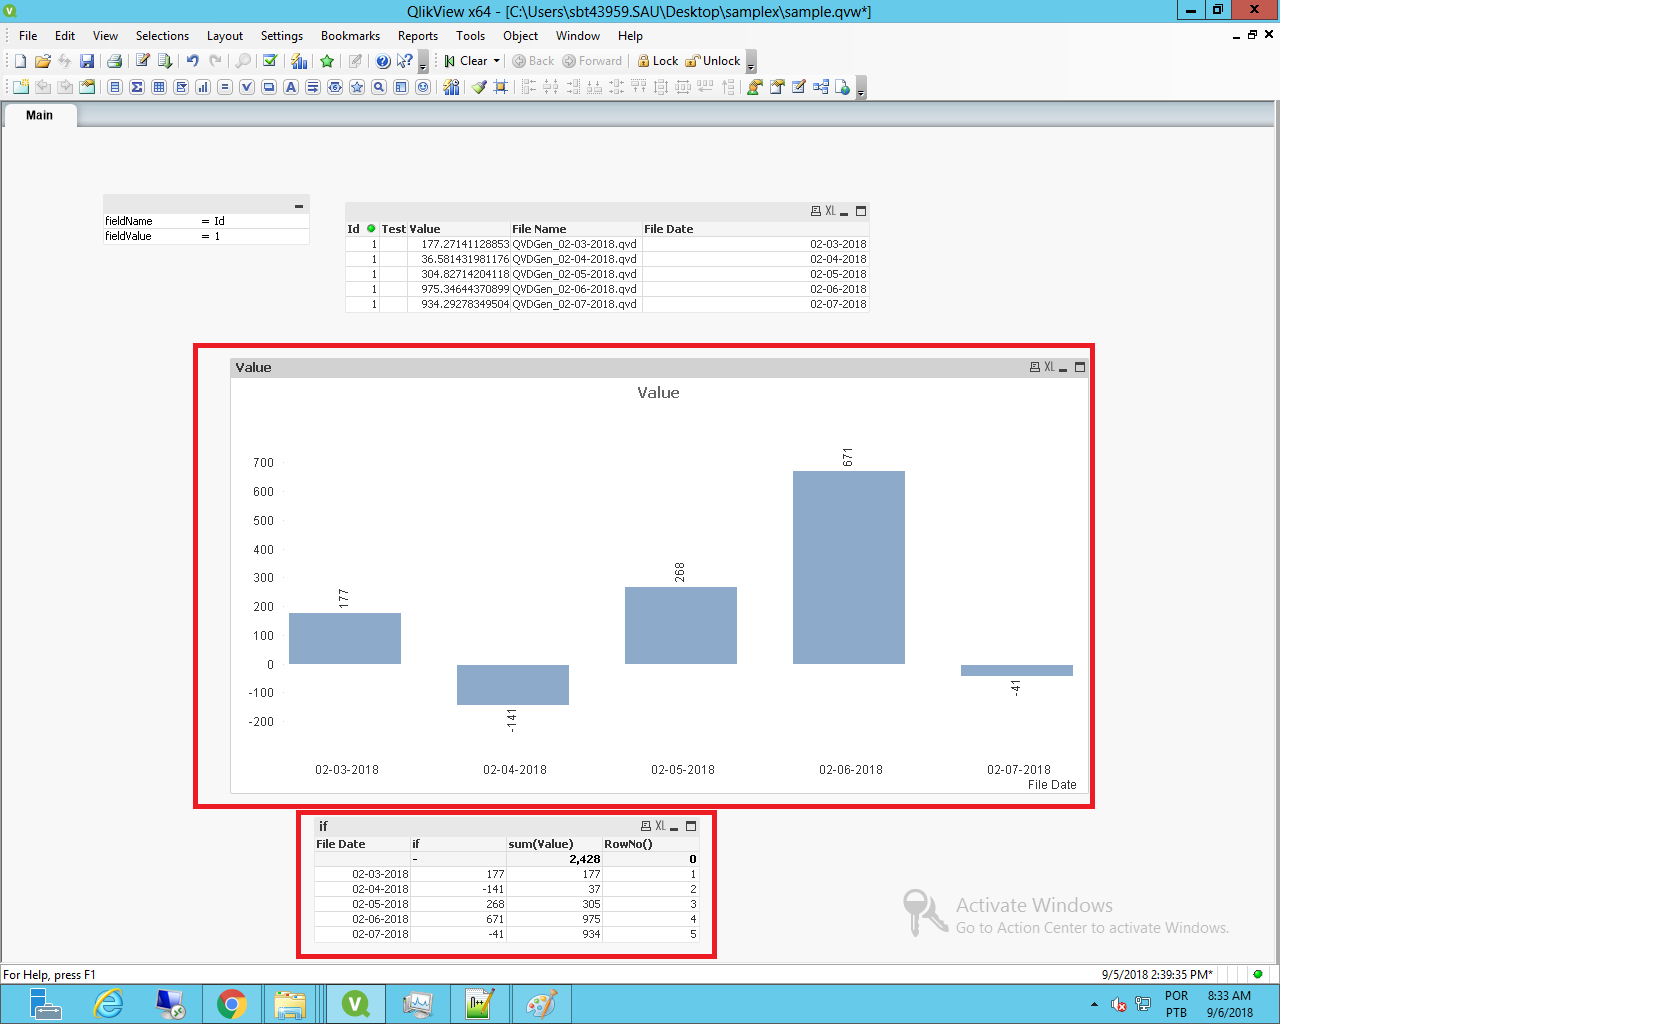
Note that the table below the graph shows what happens with the calculations.
- Mark as New
- Bookmark
- Subscribe
- Mute
- Subscribe to RSS Feed
- Permalink
- Report Inappropriate Content
Perfect Felip.
That helped me a lot... Thx for the feedback
- Mark as New
- Bookmark
- Subscribe
- Mute
- Subscribe to RSS Feed
- Permalink
- Report Inappropriate Content
No problem Daniel, glad to help .