Unlock a world of possibilities! Login now and discover the exclusive benefits awaiting you.
- Qlik Community
- :
- Forums
- :
- Analytics
- :
- New to Qlik Analytics
- :
- Re: Qlik Sense Chart Aggregation
- Subscribe to RSS Feed
- Mark Topic as New
- Mark Topic as Read
- Float this Topic for Current User
- Bookmark
- Subscribe
- Mute
- Printer Friendly Page
- Mark as New
- Bookmark
- Subscribe
- Mute
- Subscribe to RSS Feed
- Permalink
- Report Inappropriate Content
Qlik Sense Chart Aggregation
Hi
I'm having difficulty with some aggregation in Qlik Sense and was hoping for some help
My client is looking to report by period, rolling numbers for the previous 12 periods and I have created the calculation below
SUM({< [Period Index]= {">=$(=(Max([Period Index])-11))<=$(=Max([Period Index]) )"},[Main Expense Category Code] = {51,60}>} Amount)
This sums "Amount" where the period is between 12 months ago and now (based on the users selections)
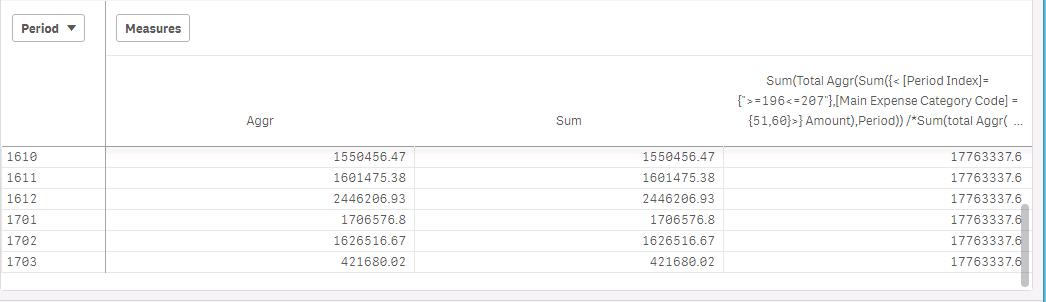
The problem I have arises when I use this in a chart (See screen shot below)
The "Aggr" Column expression is:
Sum(Aggr(Sum({1< [Period Index]= {">=$(=(Max([Period Index])-11))<=$(=Max([Period Index]) )"},[Main Expense Category Code] = {51,60}>} Amount),Period))
Where you can see I'm trying to aggregate by Period but also trying to select which periods are selected dynamically (between Max Period -11 and Max Period)
The "Sum" column expression is:
SUM({< [Period Index]= {">=$(=(Max([Period Index])-11))<=$(=Max([Period Index]) )"},[Main Expense Category Code] = {51,60}>} Amount)
So no aggregation performed here
You can see that these 2 columns are the same so my first Agg sum is clearly not working. Id expect it to be aggregating "Amounts" for the previous 12 periods and evaluate the Period Index values at each line.
The final column is:
Sum(Total Aggr(Sum({< [Period Index]= {">=$(=(Max([Period Index])-11))<=$(=Max([Period Index]) )"},[Main Expense Category Code] = {51,60}>} Amount),Period))
Where you can see I was having a play with Total Aggr but this appears to have just summed all of the amounts for the last 12 periods.
Just to confirm, For each period, I am looking to display the total amount for the last 12 periods from the period on the line
What am I missing? Would really appreciate any help
Thanks
Accepted Solutions
- Mark as New
- Bookmark
- Subscribe
- Mute
- Subscribe to RSS Feed
- Permalink
- Report Inappropriate Content
May be you are looking for this
RangeSum(Above(Sum({<[Period Index], [Main Expense Category Code] = {51,60}>} Amount), 0, 12)) * Avg(1)
- Mark as New
- Bookmark
- Subscribe
- Mute
- Subscribe to RSS Feed
- Permalink
- Report Inappropriate Content
May be you are looking for this
RangeSum(Above(Sum({<[Period Index], [Main Expense Category Code] = {51,60}>} Amount), 0, 12)) * Avg(1)
- Mark as New
- Bookmark
- Subscribe
- Mute
- Subscribe to RSS Feed
- Permalink
- Report Inappropriate Content
Thanks Sunny
Kind of works but my Period filtering still causes me issues. Think I'll need to resort to a Rolling 12 Month Calendar to resolve this
Thanks for your help
Gavin
- Mark as New
- Bookmark
- Subscribe
- Mute
- Subscribe to RSS Feed
- Permalink
- Report Inappropriate Content
Is period a field other than Period Index? If it is, then ignore selection in Period like this
RangeSum(Above(Sum({<[Period Index], [Main Expense Category Code] = {51,60}, Period>} Amount), 0, 12)) * Avg({<[Main Expense Category Code] = {51,60}>}1)
Also, added some set analysis to the Avg() function which I forgot to add initially.
HTH
Best,
Sunny