Unlock a world of possibilities! Login now and discover the exclusive benefits awaiting you.
- Qlik Community
- :
- Forums
- :
- Analytics
- :
- New to Qlik Analytics
- :
- Re: Qlik Sense Colour Expression for Area Chart
- Subscribe to RSS Feed
- Mark Topic as New
- Mark Topic as Read
- Float this Topic for Current User
- Bookmark
- Subscribe
- Mute
- Printer Friendly Page
- Mark as New
- Bookmark
- Subscribe
- Mute
- Subscribe to RSS Feed
- Permalink
- Report Inappropriate Content
Qlik Sense Colour Expression for Area Chart
Hello all
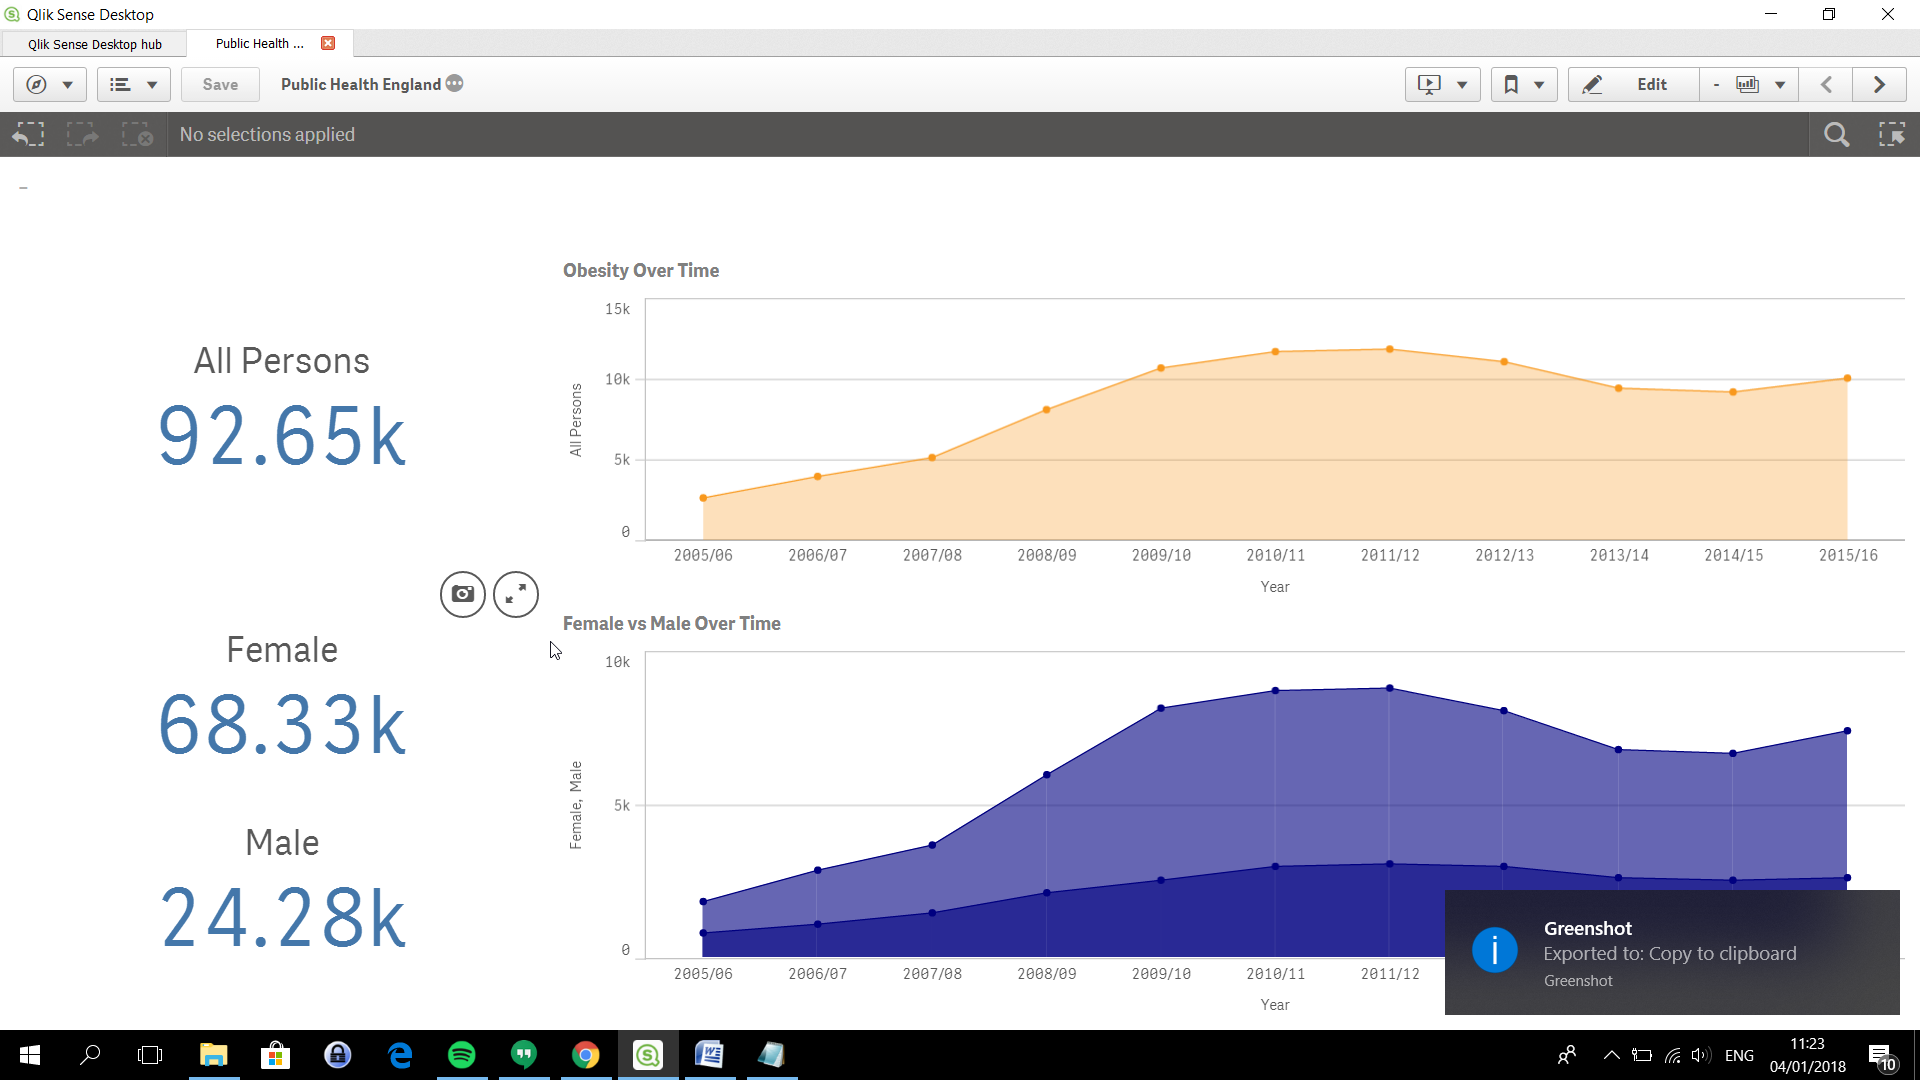
I have an area chart in Qlik Sense desktop but with two different measures. Is it possible to colour the two measures differently? What kind of colour expressions would I need to use? I've tried using the colour expression examples from the guides and various threads in this community but every time i only get a shade variant of the colour that I have input for the first measure, i never actually get the second colour for the second measure. Anyone got any ideas? I have attached the visualisation to this post.
Thanks a lot!
Bob
Accepted Solutions
- Mark as New
- Bookmark
- Subscribe
- Mute
- Subscribe to RSS Feed
- Permalink
- Report Inappropriate Content
You can't use one expression to give two different measures two different colors. What you can do is create the measures as master items and then assign different colors to those new master items. See the online help for more information: Assigning colors to master items ‒ Qlik Sense
talk is cheap, supply exceeds demand
- Mark as New
- Bookmark
- Subscribe
- Mute
- Subscribe to RSS Feed
- Permalink
- Report Inappropriate Content
That worked brilliantly, thank you so much!! 