Unlock a world of possibilities! Login now and discover the exclusive benefits awaiting you.
- Qlik Community
- :
- Forums
- :
- Analytics
- :
- New to Qlik Analytics
- :
- Qlik Sense - How do you compare current row to pre...
- Subscribe to RSS Feed
- Mark Topic as New
- Mark Topic as Read
- Float this Topic for Current User
- Bookmark
- Subscribe
- Mute
- Printer Friendly Page
- Mark as New
- Bookmark
- Subscribe
- Mute
- Subscribe to RSS Feed
- Permalink
- Report Inappropriate Content
Qlik Sense - How do you compare current row to previous row in same column
I want to track subjects that have been enrolled in concurrent years to create a cohort. I have data for 2011, 2014, and 2015.
I want to compare my current row (attendance) to previous row using a count if statement. This will become clearer when you view the attached spreadsheet.
My column headers are User Id, Year and Attendance.
I am trying to use the statement:
Count (If(Attendance='Y' and Above(Attendance) = 'Y',1,0))
I am getting a syntax error using "Above".
Thanks
David
- « Previous Replies
-
- 1
- 2
- Next Replies »
Accepted Solutions
- Mark as New
- Bookmark
- Subscribe
- Mute
- Subscribe to RSS Feed
- Permalink
- Report Inappropriate Content
- Mark as New
- Bookmark
- Subscribe
- Mute
- Subscribe to RSS Feed
- Permalink
- Report Inappropriate Content
David - Did we not resolve this here -> Year Over Year Change -- Qlik Sense
- Mark as New
- Bookmark
- Subscribe
- Mute
- Subscribe to RSS Feed
- Permalink
- Report Inappropriate Content
All,
The issue we resolved was the change in enrollment, which is what is the difference in enrollment from 2011, 2014 and 2015.
I want to now find out the number of people that were enrolled in both 2011 and 2014, then those that were enrolled in 2014 and 2015. I am looking to create a cohort. So I would need to check for a 'Y' in attendance column for 2011 and 2014, if either one of them are 'N' then they would not be counted. The same goes for 2014 and 2015.
I tried using the Above function with Count If but I can not get it to work.
I used the following expression:
If((Attendance = 'Y' and Above(Attendance = 'Y')), Count (Attendance))
however it did nothing on the bar chart..
Please let me know if you know how to do this...
Thanks
- Mark as New
- Bookmark
- Subscribe
- Mute
- Subscribe to RSS Feed
- Permalink
- Report Inappropriate Content
Something like this?
Not able to confirm the numbers, but if this is what you want, I have used the following script:
Table:
LOAD
user_id,
"Year",
Attendance
FROM [lib://Community/SampleYoYEnrollmentOnly.xls]
(biff, embedded labels, table is Sheet1$);
Table1:
LOAD Year as Year1,
Attendance as Attendance1,
user_id as user_id
Resident Table;
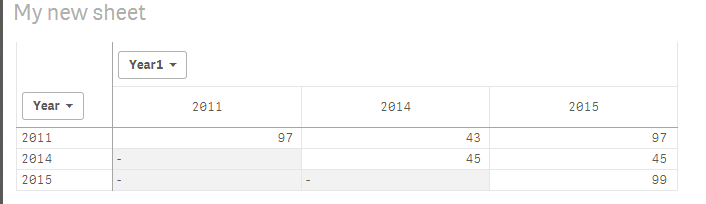
Pivot table with
Dimension
Year
Year1
Expression
If(Year <= Year1, Count({<Attendance = {'Y'}, Attendance1 = {'Y'}>}user_id))
- Mark as New
- Bookmark
- Subscribe
- Mute
- Subscribe to RSS Feed
- Permalink
- Report Inappropriate Content
I am trying what you suggested.... The code I typed is below with error message...
LOAD
user_id,
"Year",
Attendance
FROM [lib://DataFiles (win-cs6kr6sd3ts_administrator)/HuntingtonYoYEnrollmentOnly.xls]
(biff, embedded labels, table is Sheet1$);
Table1:
LOAD "Year" as Year1,
Attendance as Attendance1,
user_id as user_id
Resident Table;
Sheet1$ Lines fetched: 8,790
The following error occurred:
Table not found
The error occurred here:
Table1: LOAD "Year" as Year1, Attendance as Attendance1, user_id as user_id Resident Table
Data has not been loaded. Please correct the error and try loading again.
I got same error with "" around year and without...
Do you have any ideas what I did wrong?
What do you mean by pivot table with dimension
Year
Year1?
Thank you very much for all of your help...
- Mark as New
- Bookmark
- Subscribe
- Mute
- Subscribe to RSS Feed
- Permalink
- Report Inappropriate Content
I think you missed the table name here:
Table:
LOAD
user_id,
"Year",
Attendance
FROM [lib://DataFiles (win-cs6kr6sd3ts_administrator)/HuntingtonYoYEnrollmentOnly.xls]
(biff, embedded labels, table is Sheet1$);
Table1:
LOAD "Year" as Year1,
Attendance as Attendance1,
user_id as user_id
Resident Table;
- Mark as New
- Bookmark
- Subscribe
- Mute
- Subscribe to RSS Feed
- Permalink
- Report Inappropriate Content
That fixed the problem and I was able to load the file...
I tried to create bar graph using:
If(Year <= Year1, Count({<Attendance = {'Y'}, Attendance1 = {'Y'}>}user_id))
but when I apply it I get a blank bar graph, nothing show up. I am using year as my dimension and that equation as the measure.
I am brand new to this.... I appreciate all of your help...
Thanks for the quick response.
- Mark as New
- Bookmark
- Subscribe
- Mute
- Subscribe to RSS Feed
- Permalink
- Report Inappropriate Content
Bar graph? where did that come from? I thought you needed a pivot table, if not then we might need to change the solution a little bit 
- Mark as New
- Bookmark
- Subscribe
- Mute
- Subscribe to RSS Feed
- Permalink
- Report Inappropriate Content
Nope... I need a bar graph showing number of users that were enrolled in both 2011 and 2014, and enrolled in 2014 and 2015.
Example
I need to look at user_id 123 does this user have a Y for 2011 and a Y for 2014 attendance then I want to add 1 to count. If this same user has a Y for 2011 and N for 2014 then I want to skip. I need to do the same for 2014 and 2015.
I want to create a bar graph showing number of users enrolled in 2011 - 2014 , 2014 -2015.
I hope this helps.
Thanks
- Mark as New
- Bookmark
- Subscribe
- Mute
- Subscribe to RSS Feed
- Permalink
- Report Inappropriate Content
May be using this.
Aggr(If(Year >= Year1 and Year1 = Above(Year), Count({<Attendance = {'Y'}, Attendance1 = {'Y'}>}user_id)), Year1, Year)
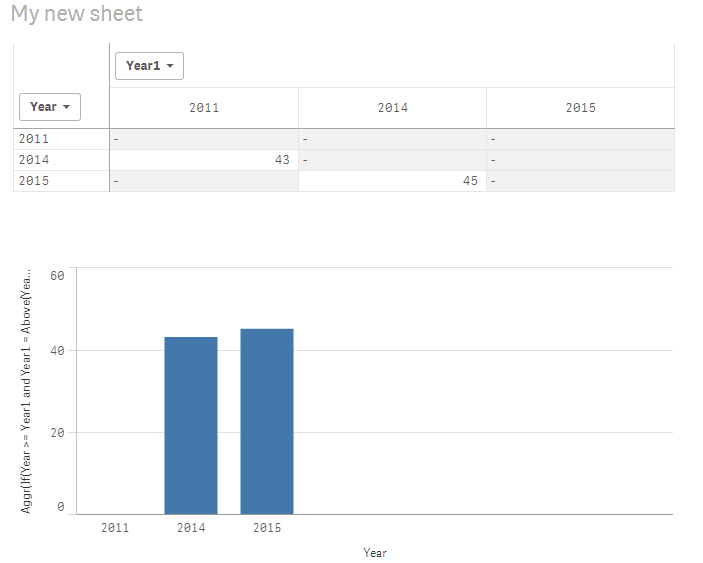
There might be a better way to do this, but this is what I was able to get right now
- « Previous Replies
-
- 1
- 2
- Next Replies »