Unlock a world of possibilities! Login now and discover the exclusive benefits awaiting you.
- Qlik Community
- :
- Forums
- :
- Analytics
- :
- New to Qlik Analytics
- :
- Re: Qlik Sense Map is Currently Showing Limited Da...
- Subscribe to RSS Feed
- Mark Topic as New
- Mark Topic as Read
- Float this Topic for Current User
- Bookmark
- Subscribe
- Mute
- Printer Friendly Page
- Mark as New
- Bookmark
- Subscribe
- Mute
- Subscribe to RSS Feed
- Permalink
- Report Inappropriate Content
Qlik Sense Map is Currently Showing Limited Data Set
Hello Qlik Community,
I'm experimenting with the Map chart that comes with Qlik Sense Server 2.2 on Windows Server 2012 R2. I have a CSV file of latitude-longitude pairs. The Map chart shows only 1935 of my over 10,000 points. There is also a footnote *Currently showing a limited data set.
From this forum, I see that Qlik Sense used to be able to render no more than 1000 points in a Map. Despite the interest in overcoming this, I haven't found any record that the limit can be exceeded as of 2016. I also didn't find anything in the server manuals, but this may be due partly to not knowing what the problem is. I have heard a rumor there is a server setting now that will allow me to map all the points. But no documentation alas.
I've tried reconfiguring the Qlik Sense Engine to allow it more memory, but this hasn't helped. I wonder whether there's some throttle on the requests that the Engine can make to the Mapbox API?
- « Previous Replies
-
- 1
- 2
- Next Replies »
- Mark as New
- Bookmark
- Subscribe
- Mute
- Subscribe to RSS Feed
- Permalink
- Report Inappropriate Content
Hi Eric,
I´ve a ticket open on Qlik Support about it. I recommend you do it also.
In my tests, we discover that QS FR 2.2.4 have more points been showed instead of QS SR209.
Regards.
OEM Solution Architect
LATAM
- Mark as New
- Bookmark
- Subscribe
- Mute
- Subscribe to RSS Feed
- Permalink
- Report Inappropriate Content
Hi,
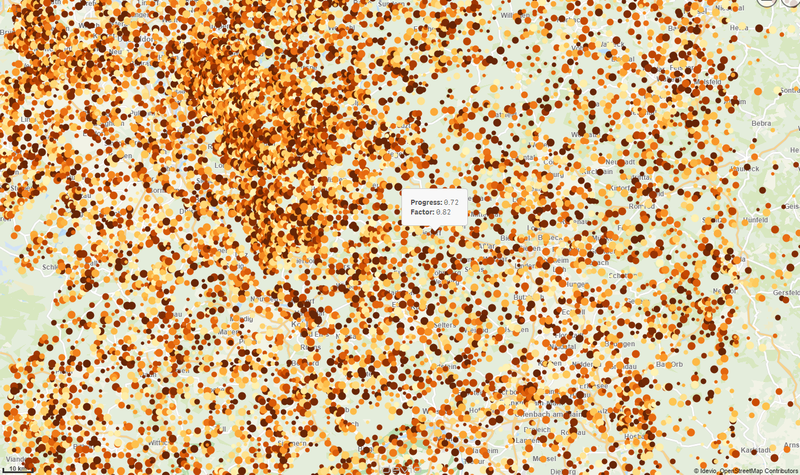
Internally Qlik transfers data in pages and I think that the Sense map is limited to read one page. In IdevioMaps (http://bi.idevio.com) we read multiple pages and can therefor in theory handle any number of points. However there are several reasons that you should not try to load too many points. I would not recommend to display more than 10000 points at a time. The limit for acceptable display performance is somewhere between 20000 and 50000 points but it seldom makes sense to display that many since the map will be too crowded. The image below shows a map with about 10000 points and it is not easy to make something out of it (even if a crowded visualization also passes a message).
The solution to this in IdevioMaps is normally to switch presentation in different scales and show aggregated data when zoomed out. Data can be aggregated in several ways, binning can group data in rectangles or hexagons, clustering can group data together that is close or data could be related to existing areas such as postal areas or zip areas.
One way is then to do drill-down hierarchies that could show something like countries when you are zoomed out. Then, when you select a country it will drill down to the next aggregation level and finally to the actual points.
Also, in IdevioMaps we can load data as you pan. If you have a dataset with millions of points you can pan around in the data when you are zoomed in and IdevioMap will load data as you pan. You then let the scale control the visualization so that an appropriate aggregated level is presented when you zoom out.
- Mark as New
- Bookmark
- Subscribe
- Mute
- Subscribe to RSS Feed
- Permalink
- Report Inappropriate Content
Hi Johan,
I believe in a exibithion limitation as you mentioned, but the number isn´t 10000. We did some tests around 2k polygons and the issue happens. But it change sometimes and theresn´t a clear understanding.
The situation is:
- Why in QS FR 2.2.4, like Erik mentioned, this situation happens different?
- If there is a limit, where´s this numbers on product or a help talking about it?
My suggestion is open a case to understand and help to getting better the product to all users.
Regards
Ricardo Gerhard
OEM Solution Architect
LATAM
- Mark as New
- Bookmark
- Subscribe
- Mute
- Subscribe to RSS Feed
- Permalink
- Report Inappropriate Content
Hi,
I've got the same problem. I wanted to upload a zip-code map of Poland (there is 20473 objects) and I've blank spaces. Is there any solution for that? Or there are no possibilities to upload the whole map?
- Mark as New
- Bookmark
- Subscribe
- Mute
- Subscribe to RSS Feed
- Permalink
- Report Inappropriate Content
Hi people,
On the version 3.0, this situation should be solved. My recomendation is: test on version 3. If this situation still happening, open a case on a Qlik to your analysis. I didn´t test on version 3 yet.
Regards.
OEM Solution Architect
LATAM
- Mark as New
- Bookmark
- Subscribe
- Mute
- Subscribe to RSS Feed
- Permalink
- Report Inappropriate Content
Hi Ricardo,
there is no changes. Still shows 2250 objects.
Regards.
- Mark as New
- Bookmark
- Subscribe
- Mute
- Subscribe to RSS Feed
- Permalink
- Report Inappropriate Content
I've just done some tests in Sense desktop 3.1.
Loading from one kml file where there are 7194 polygons, Sense shows the first 3333 polygons and the rest are blank in the map object.
Loading from another kml file, if the polygon area is more than 1895, Sense will show the error "Hypercube Results are too large". I have to limit the polygon numbers from the script to only load the first 1895 lines.
My conclusion is that if the map is not in too detail level, Sense can show the first 3333 polygons. If it is in detail levels, Sense will show less polygons.
- Mark as New
- Bookmark
- Subscribe
- Mute
- Subscribe to RSS Feed
- Permalink
- Report Inappropriate Content
Hello Fei - that is correct - you can read more here where it does mention the 3333 limit:
http://help.qlik.com/en-US/sense/3.1/Subsystems/Hub/Content/Visualizations/Map/load-map-data.htm
When applicable please mark the appropriate replies as CORRECT. This will help community members and Qlik Employees know which discussions have already been addressed and have a possible known solution. Please mark threads as HELPFUL if the provided solution is helpful to the problem, but does not necessarily solve the indicated problem. You can mark multiple threads as HELPFUL if you feel additional info is useful to others.
Regards,
Mike Tarallo
Qlik
Mike Tarallo
Qlik
- Mark as New
- Bookmark
- Subscribe
- Mute
- Subscribe to RSS Feed
- Permalink
- Report Inappropriate Content
Has there been any movement on this issue? I would be of the thinking that there is someway you can alter the settings so it will automatically allow a full dataset to be viewed.
- « Previous Replies
-
- 1
- 2
- Next Replies »