Unlock a world of possibilities! Login now and discover the exclusive benefits awaiting you.
- Qlik Community
- :
- Forums
- :
- Analytics
- :
- New to Qlik Analytics
- :
- Qlik Sense plot bar chart as a waterfall chart
- Subscribe to RSS Feed
- Mark Topic as New
- Mark Topic as Read
- Float this Topic for Current User
- Bookmark
- Subscribe
- Mute
- Printer Friendly Page
- Mark as New
- Bookmark
- Subscribe
- Mute
- Subscribe to RSS Feed
- Permalink
- Report Inappropriate Content
Qlik Sense plot bar chart as a waterfall chart
Hi,
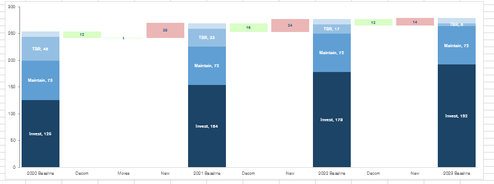
I wanted to plot waterfall chart in Bar chart or combo chart.
I am aware that there is a separate waterfall chart in qlik sense however it has some limitation. if there are multiple dimension or measure used in qlik waterfall chart we can not select it. I mean to say if I want to select a particular bar & check the values for it accordingly it is not possible in Qlik Waterfall chart.
So I am hoping that we can make waterfall chart in Bar chart or combo chart so that we can select some values in it.
Below is the sample data & sample chart which I wanted to plot in bar chart or combo chart.
| Milestone | Total | Float | Invest | Maintain | TBR | Other | Count | Increase | Decrease |
| 2020 Baseline | 254 | 0 | 126 | 73 | 45 | 10 | 254 | ||
| Decom 2020 | 12 | 242 | 12 | ||||||
| Moves | 1 | 241 | 1 | ||||||
| New 2020 | 28 | 242 | 28 | ||||||
| 2021 Baseline | 269 | 0 | 154 | 72 | 33 | 10 | 269 | ||
| Decom 2021 | 16 | 253 | 16 | ||||||
| New 2021 | 24 | 253 | 24 | ||||||
| 2022 Baseline | 277 | 0 | 178 | 72 | 17 | 10 | 277 | ||
| Decom 2022 | 12 | 265 | 12 | ||||||
| New 2022 | 14 | 265 | 14 | ||||||
| 2023 Baseline | 279 | 0 | 192 | 72 | 5 | 10 | 279 |
Please note that I need this in Qlik Sense & in bar chart or combo chart not in waterfall chart.
@avinashelite , @kushalthakral , @Anil_Babu_Samineni , @MayilVahanan , @tresesco , @sunny_talwar , @its_anandrjs , @eliran , @marcus_sommer
- Tags:
- chart
- qlik sense app
- Mark as New
- Bookmark
- Subscribe
- Mute
- Subscribe to RSS Feed
- Permalink
- Report Inappropriate Content
So far my knowledge, You are not able to achieve in Qlik sense.
