Unlock a world of possibilities! Login now and discover the exclusive benefits awaiting you.
- Qlik Community
- :
- Forums
- :
- Analytics
- :
- New to Qlik Analytics
- :
- Re: QlikSense - How can you render a qvd in a repo...
- Subscribe to RSS Feed
- Mark Topic as New
- Mark Topic as Read
- Float this Topic for Current User
- Bookmark
- Subscribe
- Mute
- Printer Friendly Page
- Mark as New
- Bookmark
- Subscribe
- Mute
- Subscribe to RSS Feed
- Permalink
- Report Inappropriate Content
QlikSense - How can you render a qvd in a report ?
I have generated a QVD using a query (QVS). This query does a "Group By" and then "OrderBy" on rows of a database table. It is generated successfully and when I select the qvd in the data load editor, I can see the sorted rows.
I have a few questions on this :
- I am a little confused by this as I read multiple posts which said that sorting can be done only on Resident tables. I am not using resident tables at all while generating this qvd and I can see the sorted rows in the data load editor.
- How can I view this qvd data in a report ? IN other words, how do I add this qvd as a sheet object ? That way, I can use the configurator to get a URL to the report.
- How do I periodically refresh this qvd with the latest data ? I would like the query to be executed 4 times a day and the qvd to be refreshed so that anybody consuming the report would be see the latest data.
Thank you !
- Mark as New
- Bookmark
- Subscribe
- Mute
- Subscribe to RSS Feed
- Permalink
- Report Inappropriate Content
W.r.t the order of records: I assume you are using ORDER BY in the SQL / SELECT part of your script statement.
The posts mentioning that ordering is only possible with resident tables are referring to a LOAD statement with an order by clause.
If you want to show the all data in your app, you can load the table using the data load editor (maybe a field with a unique key e.g. using Recno() ), then create a straight table chart in your UI and drag in all fields as dimensions.
- Mark as New
- Bookmark
- Subscribe
- Mute
- Subscribe to RSS Feed
- Permalink
- Report Inappropriate Content
The posts mentioning that ordering is only possible with resident tables are referring to a LOAD statement with an order by clause.
Got it. This means that Resident tables are to be used when further transforming data from QVDs.
This is how my QVD looks like (sensitive data blacked out). I would like to add this to a sheet as an object so that I can get a link to this in the Single Configurator . 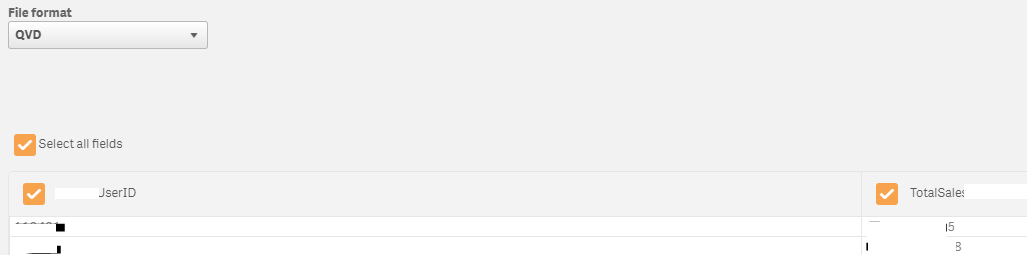
But I cannot get the entire table into the sheet. I can see the two columns from the above QVD but when I add them individually, the data is all out of sync and does not resemble the data as seen in the qvd above.
- Mark as New
- Bookmark
- Subscribe
- Mute
- Subscribe to RSS Feed
- Permalink
- Report Inappropriate Content
Qlik provides the ability to manipulate data. The Sort By clause gives the ability to sort data. You are then able to store the results into a QVD. In the front end, if desired, you can control the sort order of the rows by not selecting sort, which should default to the natural load order of the data. You could consider using the autonumber feature to count records and sort off of that. You could introduce creating/using an inline table that provides the ability to map records to your desired sort order too. If I am understanding your use case, there are numerous methods to address. Sort By Asc seems to make the most sense. You can store this table of data into a QVD. Remember, QVDs can be tiered (i.e. layered)...you can have numerous levels (layers) of QVDs.
-gw
- Mark as New
- Bookmark
- Subscribe
- Mute
- Subscribe to RSS Feed
- Permalink
- Report Inappropriate Content
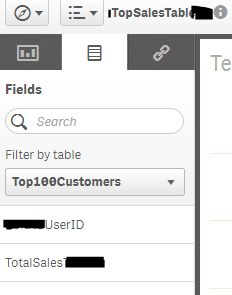
Agreed, but what I am trying to say is that my QVD already has the sorted data which I can view (see a representative of this in the first pic one post back). As an illustration, I can see something like the table below in my QVD. I can see this QVD data via the Data Load Editor.
TABLE 1
User ID TotalSales
323 50
2 40
23 30
567 20
29 10
Now I reference this data in my app ("Add Data" via Data manager) and then add Tables to the sheet. Now, (reference the second pic in my previous post) when I try to add the columns one by one from the drop down as "Dimensions", I am expecting Table 1 above. Instead, I see the table below. As you can see, Qlik has sorted each row ...... and this is total garbage compared to Table 1 !
User ID TotalSales
2 10
23 20
29 30
323 40
567 50
This is just my third day using Qlik, so apologies if I am missing something basic !
- Mark as New
- Bookmark
- Subscribe
- Mute
- Subscribe to RSS Feed
- Permalink
- Report Inappropriate Content
I can't really see much in your screen shots, specifically how you have created your UI object.
My suggestion was to use a straight table chart object and use all fields as dimensions and no expression.
You would need a primary key in your data table to see all records (since dimensions only show unique combinations).
- Mark as New
- Bookmark
- Subscribe
- Mute
- Subscribe to RSS Feed
- Permalink
- Report Inappropriate Content
Aren't you able to change the sort order in chart properties to second column, desc, in chart properties (drag the second column name to the top to change sort order and select descending).
Sort orders are set per chart.
- Mark as New
- Bookmark
- Subscribe
- Mute
- Subscribe to RSS Feed
- Permalink
- Report Inappropriate Content
Ok, the problem turned out to be one of dimensioning which you had pointed out a few posts ago (and which I missed  ). I added one of the columns as a dimension and then the second one as a normal columns and sorted one column. Now, the data aligns perfectly. Thanks !