Unlock a world of possibilities! Login now and discover the exclusive benefits awaiting you.
- Qlik Community
- :
- Forums
- :
- Analytics
- :
- New to Qlik Analytics
- :
- Re: Question - Tutorial Master Calender
- Subscribe to RSS Feed
- Mark Topic as New
- Mark Topic as Read
- Float this Topic for Current User
- Bookmark
- Subscribe
- Mute
- Printer Friendly Page
- Mark as New
- Bookmark
- Subscribe
- Mute
- Subscribe to RSS Feed
- Permalink
- Report Inappropriate Content
Question - Tutorial Master Calender
Hi,
i try this tutorial and his data: Understanding the Master Calendar (video)
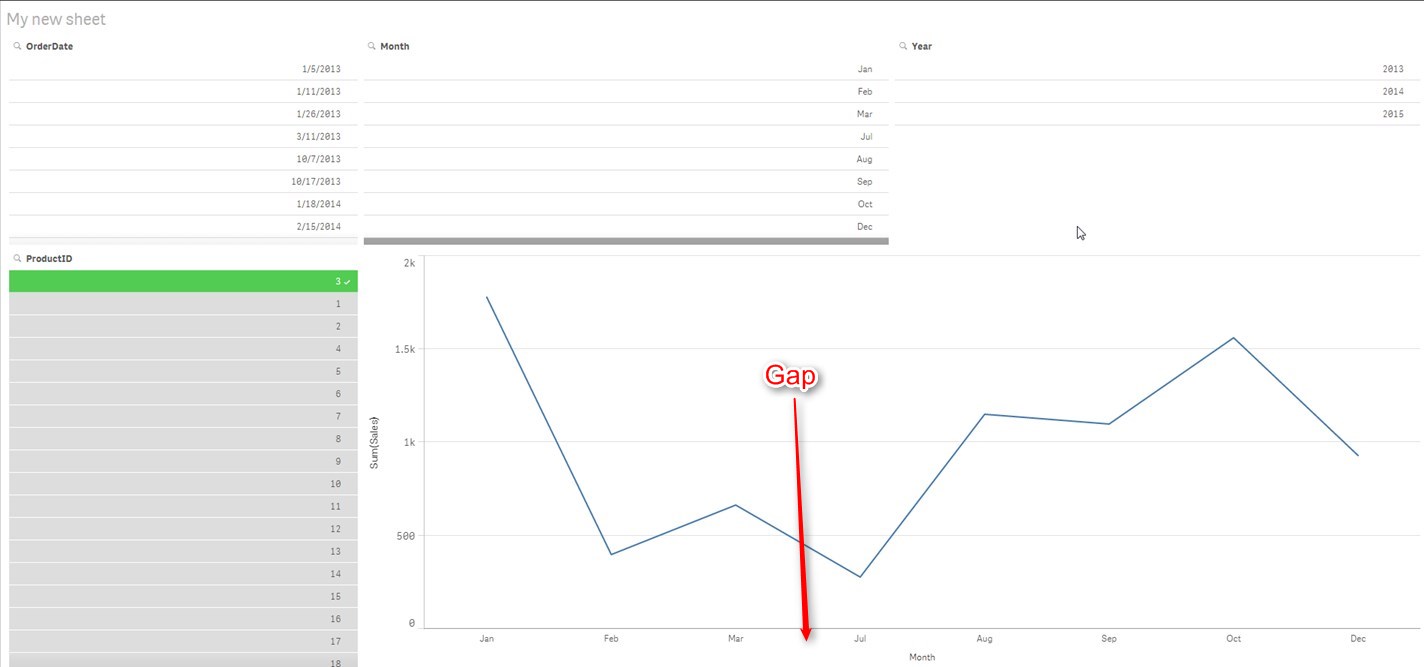
I put the field "ProductID" to the worksheet. If i choose one ProductID there is a gap in the diagramm.
How can i show all month?
regards,
Fritz
Accepted Solutions
- Mark as New
- Bookmark
- Subscribe
- Mute
- Subscribe to RSS Feed
- Permalink
- Report Inappropriate Content
Hi,
If there is no data for the missing then QS/QV will skip those months in the axes. To fill this you have try any of this two methods
1. Fill the missing months with 0s by using techniques in this two documents
How to populate a sparsely populated field
Generating Missing Data In QlikView
2. In Qlikview there is an option called Show All Values in Dimension Tab for each dimension, I am not sure whether the same exists in Qliksense, try if this option is there. I think HIC has given workaround for this in below thread
QlikSense Dimension: show all values like QlikView?
Regards,
Jagan.
- Mark as New
- Bookmark
- Subscribe
- Mute
- Subscribe to RSS Feed
- Permalink
- Report Inappropriate Content
Hi Fritz,
Are you using the dates in your table to generate the master calendar. If there are any dates missing you will not be able to do it. You need to fetch the Min(date) and Max(date) and generate the calender for all the dates between the min and max dates. Doing it that way you will not have a gap as above.
Check this script:
QuartersMap:
MAPPING LOAD
rowno() as Month,
'Q' & Ceil (rowno()/3) as Quarter
AUTOGENERATE (12);
Let varMinDate = Num('01/01/2016');
Let varMaxDate = Num('31/12/2016');
TempCalendar:
LOAD
$(varMinDate) + Iterno()-1 As Num,
Date($(varMinDate) + IterNo() - 1) as TempDate
AutoGenerate 1 While $(varMinDate) + IterNo() -1 <= $(varMaxDate);
[Master Calendar]:
Load
TempDate AS [Date],
week(TempDate) As [Week],
Year(TempDate) As [Year],
Month(TempDate) As [Month],
Day(TempDate) As [Day],
YeartoDate(TempDate)*-1 as [CurYTDFlag],
YeartoDate(TempDate,-1)*-1 as [LastYTDFlag],
inyear(TempDate, Monthstart($(varMaxDate)),-1) as [RC12],
date(monthstart(TempDate), 'MMM-YYYY') as [MonthYear],
ApplyMap('QuartersMap', month(TempDate), Null()) as [Quarter],
Week(weekstart(TempDate)) & '-' & WeekYear(TempDate) as [WeekYear],
WeekDay(TempDate) as [WeekDay]
Resident TempCalendar
Order By TempDate ASC;
store [Master Calendar] into [lib://WOC Debts Extracts/master_calander.qvd];
Drop Table TempCalendar;
- Mark as New
- Bookmark
- Subscribe
- Mute
- Subscribe to RSS Feed
- Permalink
- Report Inappropriate Content
Hi Sangram,
thanks...i try your script and got this error:
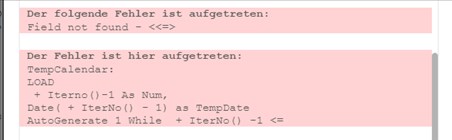
regards,
Fritz
- Mark as New
- Bookmark
- Subscribe
- Mute
- Subscribe to RSS Feed
- Permalink
- Report Inappropriate Content
Hi Fritz,
Check if the variables varMinDate and varMaxDate have values in them while execution. As per your screen shot the value in varMaxDate is missing.
To rectify this change the date format of the variables to your system date format and give a try:
Let varMinDate = Num('01/01/2016'); -> change it your date format
Let varMaxDate = Num('31/12/2016'); -> change it your date format
Thanks,
Sangram
- Mark as New
- Bookmark
- Subscribe
- Mute
- Subscribe to RSS Feed
- Permalink
- Report Inappropriate Content
Hi Sangram,
i change it to...
Let varMinDate = Num('01.01.2014');
Let varMaxDate = Num('31.12.2016');
...and got no error.
But there are still the gaps, if i choose a ProductID.
regards,
Fritz
- Mark as New
- Bookmark
- Subscribe
- Mute
- Subscribe to RSS Feed
- Permalink
- Report Inappropriate Content
Probably you need to generate your missing data, see:
How to populate a sparsely populated field
Generating Missing Data In QlikView
- Marcus
- Mark as New
- Bookmark
- Subscribe
- Mute
- Subscribe to RSS Feed
- Permalink
- Report Inappropriate Content
Hi,
If there is no data for the missing then QS/QV will skip those months in the axes. To fill this you have try any of this two methods
1. Fill the missing months with 0s by using techniques in this two documents
How to populate a sparsely populated field
Generating Missing Data In QlikView
2. In Qlikview there is an option called Show All Values in Dimension Tab for each dimension, I am not sure whether the same exists in Qliksense, try if this option is there. I think HIC has given workaround for this in below thread
QlikSense Dimension: show all values like QlikView?
Regards,
Jagan.
- Mark as New
- Bookmark
- Subscribe
- Mute
- Subscribe to RSS Feed
- Permalink
- Report Inappropriate Content
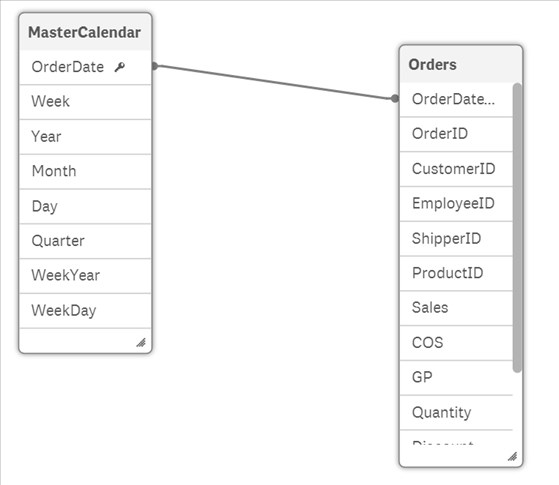
Id the Master Calendar linked to your data model. Once linked, make use of the linked date field to plot the graph.
Thanks,
Sangram.
- Mark as New
- Bookmark
- Subscribe
- Mute
- Subscribe to RSS Feed
- Permalink
- Report Inappropriate Content
Sorry, i´m not sure to understand what you said. "OrderID" should be in another table which is not connect with table "MasterCalendar"?
regards,
Fritz
- Mark as New
- Bookmark
- Subscribe
- Mute
- Subscribe to RSS Feed
- Permalink
- Report Inappropriate Content
Hi Jagan,
this helps:
Sum( Sales ) + 0 * Sum( {1} Sales ) - QlikSense Dimension: show all values like QlikView?
Thank you and to the others for your help.
regrads,
Fritz