Unlock a world of possibilities! Login now and discover the exclusive benefits awaiting you.
- Qlik Community
- :
- Forums
- :
- Analytics
- :
- New to Qlik Analytics
- :
- Re: Questions about dimension and date
- Subscribe to RSS Feed
- Mark Topic as New
- Mark Topic as Read
- Float this Topic for Current User
- Bookmark
- Subscribe
- Mute
- Printer Friendly Page
- Mark as New
- Bookmark
- Subscribe
- Mute
- Subscribe to RSS Feed
- Permalink
- Report Inappropriate Content
Questions about dimension and date
Hi,
i want to show always each month on the x-scale, no matter wich filter. How can i do that?
You see in the attachment are not all 12 month, may and dec are missing.
And the month are not correctly sort. Why? How can i change it?
Can you help me? Or have somebody an example app?
Regards,
Fritz
I added an example. If i filter for example for "Computer" there are no each month. And the month are not sort correct. Regards, Fritz
- Mark as New
- Bookmark
- Subscribe
- Mute
- Subscribe to RSS Feed
- Permalink
- Report Inappropriate Content
Would you be able to share a sample. I believe it would be easier to help you that ways 
- Mark as New
- Bookmark
- Subscribe
- Mute
- Subscribe to RSS Feed
- Permalink
- Report Inappropriate Content
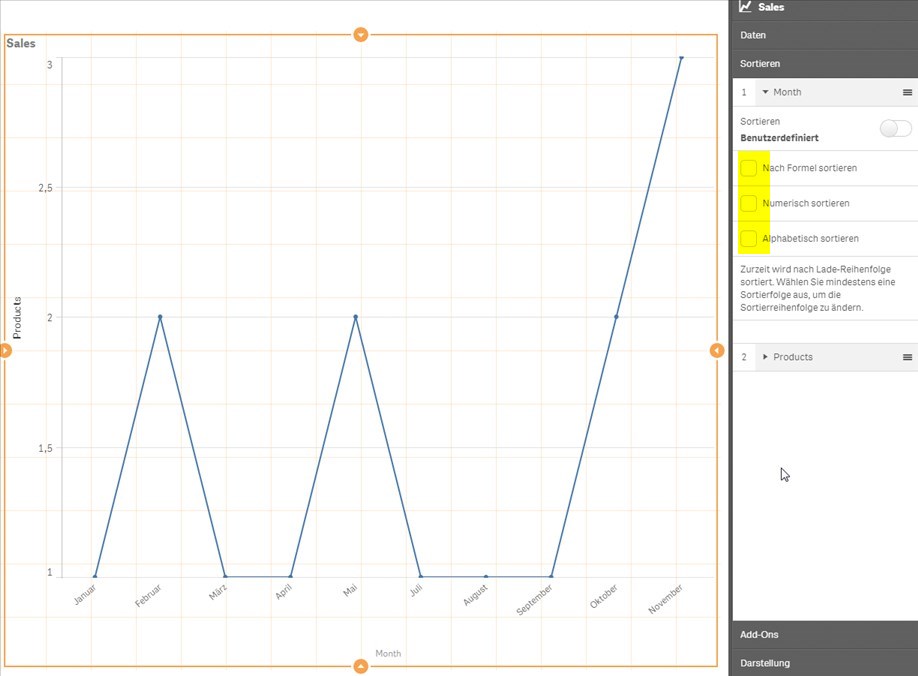
Your month values should be dual values, so you can sort the dimension values by numeric value.
Currently, it seems you sort by y-value descending. Go to sort tab and change the sort order.
To show all months no matter what values you have filtered, try something like
=Sum(Value) + Sum({1} 0 )
as expression, and disable 'Suppress zero values' on presentation tab.
- Mark as New
- Bookmark
- Subscribe
- Mute
- Subscribe to RSS Feed
- Permalink
- Report Inappropriate Content
Hi Fritz,
you can achieve all the problems you are facing either by adding expressions or by changing properties in the properties panel.
It would be easier to solve and suggest you what to do if you can attach a sample qvf file.
Thanks and Regards,
Sangram Reddy.
- Mark as New
- Bookmark
- Subscribe
- Mute
- Subscribe to RSS Feed
- Permalink
- Report Inappropriate Content
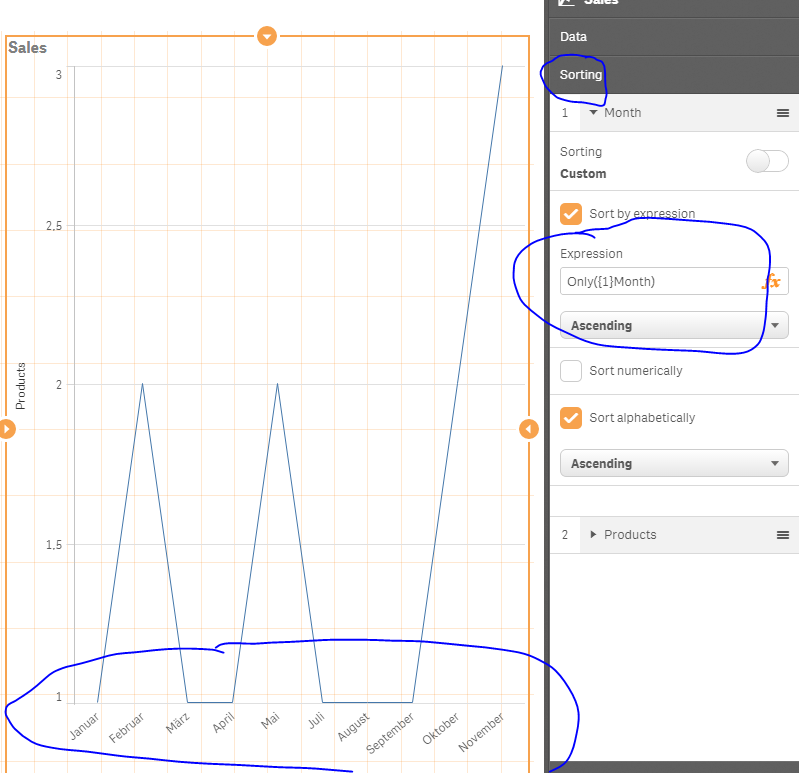
Try with sorting expression of =Only({1} Month)
- Mark as New
- Bookmark
- Subscribe
- Mute
- Subscribe to RSS Feed
- Permalink
- Report Inappropriate Content
Thank you. I made this and it runs.
- Mark as New
- Bookmark
- Subscribe
- Mute
- Subscribe to RSS Feed
- Permalink
- Report Inappropriate Content
Hi,
i have found a solution (see attachment). But i think there is an easier way.
My next question is, how can i add the month in a second line? See screenshot.
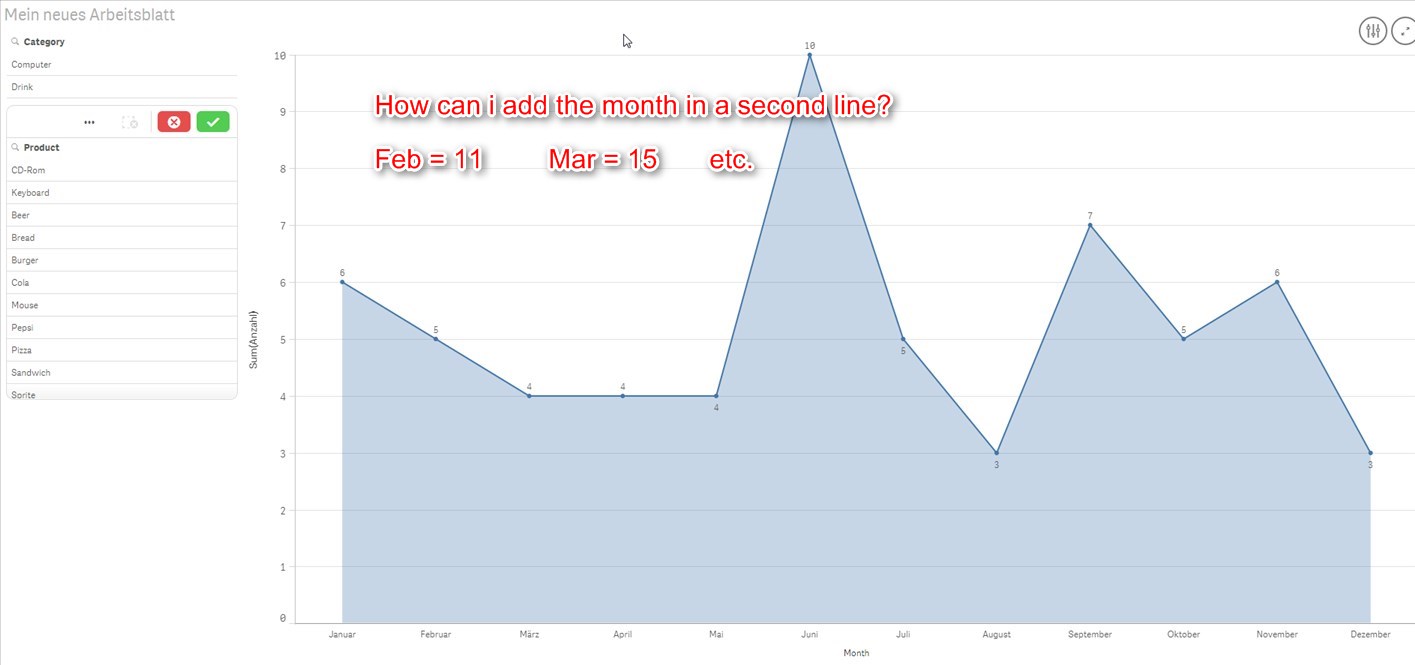
Regards,
Fritz
- Mark as New
- Bookmark
- Subscribe
- Mute
- Subscribe to RSS Feed
- Permalink
- Report Inappropriate Content
I have found a solution:

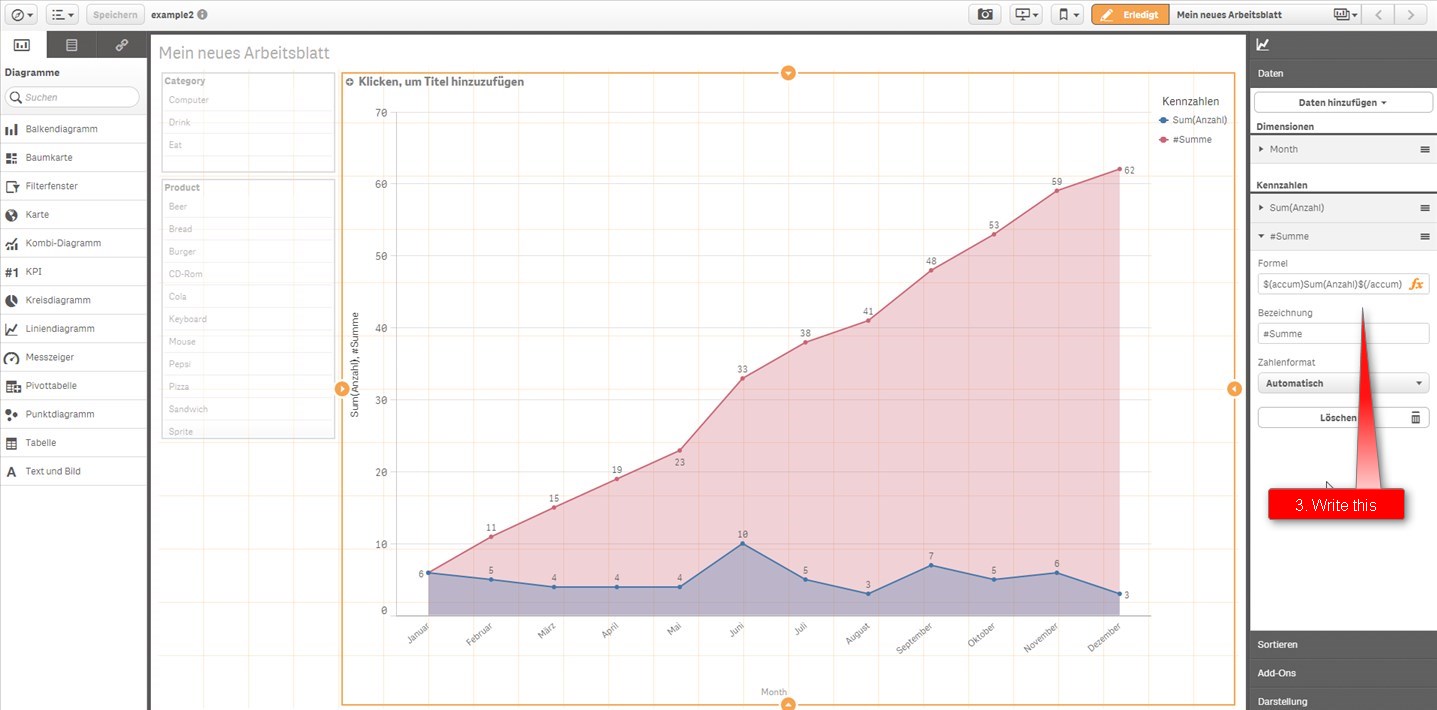
Regards,
Fritz