Unlock a world of possibilities! Login now and discover the exclusive benefits awaiting you.
- Qlik Community
- :
- Forums
- :
- Analytics
- :
- New to Qlik Analytics
- :
- RECURSIVE average 12 months ago
- Subscribe to RSS Feed
- Mark Topic as New
- Mark Topic as Read
- Float this Topic for Current User
- Bookmark
- Subscribe
- Mute
- Printer Friendly Page
- Mark as New
- Bookmark
- Subscribe
- Mute
- Subscribe to RSS Feed
- Permalink
- Report Inappropriate Content
RECURSIVE average 12 months ago
Hi all! Thanks a lot for your help 😁
Today I bring the following question: I must calculate a forecast value on my data that works as follows: I have historical sales information until the previous month of the month running, for dates that have already passed the value of my forecast will be the same sale value, but the value forecast for future dates, should correspond to calculate the average of that forecast 12 months ago.
Then: To calculate the forecast for July 2020 it is enough to average the sales from June20 to July19.
To calculate the forecast for August, the calculation would take the value that I just calculated as forecast for July 20 as month 12 and averages it with the previous 11 months, which would be the same sale value.
To calculate the September forecast, the calculation would take the calculated value of August20, July20 and the previous 10 months that will correspond to the sale.
I must take this value to the visual layer on a pivot table with the months in columns and a combined graph displayed by year-month.

I do not know if it is possible to do the calculation from the visual layer, however I have tried it and I cannot achieve recursion. I understand that the calculation must be done from the script, however I am not very clear how to achieve recursion
thank you! I hope you can help me 😅
Diana.
- Mark as New
- Bookmark
- Subscribe
- Mute
- Subscribe to RSS Feed
- Permalink
- Report Inappropriate Content
Would you be able to provide raw sample data where we can see what you have? An app where the data is already loaded will be a plus.
- Mark as New
- Bookmark
- Subscribe
- Mute
- Subscribe to RSS Feed
- Permalink
- Report Inappropriate Content
Hi! Thanks for your time,
I cannot attach the application as it has a lot of confidential information, however I can attach the base source of the calculation a little modified so as not to expose confidential data.
The UNITS (UNIDADES) column corresponds to the sale value column
- Mark as New
- Bookmark
- Subscribe
- Mute
- Subscribe to RSS Feed
- Permalink
- Report Inappropriate Content
// Assuming that sum(UNIDADES) is your measure you can change it according to your data

Data:
LOAD
    Fecha,
    Mes,
    Año,
    Monthname(Date#(Año&Mes,'YYYYMM')) as Month,
    CLIENTE,
    Canal,
    COD,
    UNIDADES
FROM [lib://Data/muestra_forecast.xlsx]
(ooxml, embedded labels, table is Hoja1);

MONTHLY_UNIDADES:
Load Month,
     sum(UNIDADES) as MONTHLY_UNIDADES
Resident Data
Group by Month;

// you can specify here for how many month further you need do your forecast based on your need
let vForecastMonths = 6; //assuming forecast for next 6 month

Concatenate(MONTHLY_UNIDADES)
Load Monthname(MinMonth,IterNo()-1) as Month,
     1 as ForecastFlag
While IterNo()<=$(vForecastMonths);
Load AddMonths(Max(Month),1) as MinMonth;
Load FieldValue('Month',RecNo()) as Month
AutoGenerate FieldValueCount('Month');

Forecast:
load  Month,
     If(ForecastFlag=1,
      RangeAvg(
if(Peek(MONTHLY_UNIDADES,-12)>0,Peek(MONTHLY_UNIDADES,-12),Peek(MONTHLY_UNIDADES_FORECAST,-12)),
if(Peek(MONTHLY_UNIDADES,-11)>0,Peek(MONTHLY_UNIDADES,-11),Peek(MONTHLY_UNIDADES_FORECAST,-11)),
if(Peek(MONTHLY_UNIDADES,-10)>0,Peek(MONTHLY_UNIDADES,-10),Peek(MONTHLY_UNIDADES_FORECAST,-10)),
if(Peek(MONTHLY_UNIDADES,-9)>0,Peek(MONTHLY_UNIDADES,-9),Peek(MONTHLY_UNIDADES_FORECAST,-9)),
if(Peek(MONTHLY_UNIDADES,-8)>0,Peek(MONTHLY_UNIDADES,-8),Peek(MONTHLY_UNIDADES_FORECAST,-8)),
if(Peek(MONTHLY_UNIDADES,-7)>0,Peek(MONTHLY_UNIDADES,-7),Peek(MONTHLY_UNIDADES_FORECAST,-7)),
if(Peek(MONTHLY_UNIDADES,-6)>0,Peek(MONTHLY_UNIDADES,-6),Peek(MONTHLY_UNIDADES_FORECAST,-6)),
if(Peek(MONTHLY_UNIDADES,-5)>0,Peek(MONTHLY_UNIDADES,-5),Peek(MONTHLY_UNIDADES_FORECAST,-5)),
if(Peek(MONTHLY_UNIDADES,-4)>0,Peek(MONTHLY_UNIDADES,-4),Peek(MONTHLY_UNIDADES_FORECAST,-4)),
if(Peek(MONTHLY_UNIDADES,-3)>0,Peek(MONTHLY_UNIDADES,-3),Peek(MONTHLY_UNIDADES_FORECAST,-3)),
if(Peek(MONTHLY_UNIDADES,-2)>0,Peek(MONTHLY_UNIDADES,-2),Peek(MONTHLY_UNIDADES_FORECAST,-2)),
if(Peek(MONTHLY_UNIDADES,-1)>0,Peek(MONTHLY_UNIDADES,-1),Peek(MONTHLY_UNIDADES_FORECAST,-1))),
MONTHLY_UNIDADES) as MONTHLY_UNIDADES_FORECAST
Resident MONTHLY_UNIDADES
Order by Month;

Drop Table MONTHLY_UNIDADES;

you can check the values of forecast in "MONTHLY_UNIDADES_FORECAST" field
- Mark as New
- Bookmark
- Subscribe
- Mute
- Subscribe to RSS Feed
- Permalink
- Report Inappropriate Content
Hello Kush,
thank you very much for your help, the code generates an error when loading Table Forecast1 ... will the correct load be from Table MONTHLY_UNIDADES?
- Mark as New
- Bookmark
- Subscribe
- Mute
- Subscribe to RSS Feed
- Permalink
- Report Inappropriate Content
It was a typo. correct table is MONTHLY_UNIDADES. I have updated my original reply
- Mark as New
- Bookmark
- Subscribe
- Mute
- Subscribe to RSS Feed
- Permalink
- Report Inappropriate Content
Thank you very much for your support! the solution works for summation grouped by months 😁🌟 ... do you think you could tell me how I should do it if I wanted to make the forecast considering also the CLIENTE, Canal and COD fields.
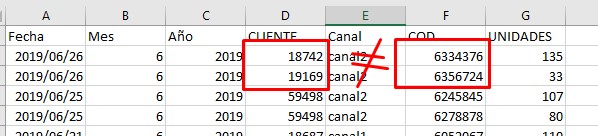
In the source that I reference (new requirement to take into account beyond the month) each grouping of Fecha, Mes, Año, CLIENTE, COD, Canal, UNITS matters and is the guide. For example, it is not correct to average the units sold over past dates if this involves adding those of customer 19169 of code 6356724 to customer units sold 18742 of the code 6334376.
I must forecast but taking into account doing it on the same set of analysis concepts. I do not understand very well how to maintain the distribution towards the future of Fecha, Mes, Año, CLIENTE, COD, Canal and make projections only against those data sets.
- Mark as New
- Bookmark
- Subscribe
- Mute
- Subscribe to RSS Feed
- Permalink
- Report Inappropriate Content
In this case your solution need to be front end solutions. But not exactly as you still need to do some scripting to achieve it. Below script basically generates the forecast date for each possible combination of dimension. So that for each dimension value you will have forecast Months in your data. If you want to add more dimension, you can add it in highlighted part of the code.
Data:
LOAD
Fecha,
Mes,
Año,
Monthname(Date#(Año&Mes,'YYYYMM')) as Month,
CLIENTE,
Canal,
COD,
AutoNumberHash256(CLIENTE&Canal&COD&Monthname(Date#(Año&Mes,'YYYYMM'))) as Key,
UNIDADES
FROM [lib://Data/muestra_forecast.xlsx]
(ooxml, embedded labels, table is Hoja1);
let vForecastMonths = 6;
T1:
Load Distinct CLIENTE,
Canal,
COD
Resident Data;
Left Join (T1)
Load Monthname(MinMonth,IterNo()-1) as Month,
1 as ForecastFlag
While IterNo()<=$(vForecastMonths);
Load AddMonths(Max(Month),1) as MinMonth;
Load FieldValue('Month',RecNo()) as Month
AutoGenerate FieldValueCount('Month');
T2:
NoConcatenate
Load *,
AutoNumberHash256(CLIENTE&Canal&COD&Month) as Key2
Resident T1;
Drop Table T1;
Concatenate(Data)
Load *
Resident T2
Where not Exists(Key,Key2);
Drop Table T2;
Now you can create the chart with following Dimension & Measure. You can then select any Dimension value which will dynamically calculate the forecast.
Dimension:
Month
Expression:
=sum(aggr(sum({<Month>}aggr(if(Sum({<Month>}UNIDADES)>0,Sum({<Month>}UNIDADES),
RangeAvg(above(total Column(1),1,12))),Month)),Month))*avg(1)
In above expression I have used column(1) so this measure should always be first measure of your graph. If it is not then use column(2) or column(3) based on to which number your measure is