Unlock a world of possibilities! Login now and discover the exclusive benefits awaiting you.
- Qlik Community
- :
- Forums
- :
- Analytics
- :
- New to Qlik Analytics
- :
- Re: Rank in a KPI chart
- Subscribe to RSS Feed
- Mark Topic as New
- Mark Topic as Read
- Float this Topic for Current User
- Bookmark
- Subscribe
- Mute
- Printer Friendly Page
- Mark as New
- Bookmark
- Subscribe
- Mute
- Subscribe to RSS Feed
- Permalink
- Report Inappropriate Content
Rank in a KPI chart
Hi,
Is it possible to show a tied rank in a KPI chart?
Below is the same measure but one is in a table and one is in a KPI. I can't get the KPI to display the 8-14.
I have already tried to change the format in the script e.g. rank(xxx ,0,0) but I only get either 8 or 14 - depending on the formatting).
Thanks
Accepted Solutions
- Mark as New
- Bookmark
- Subscribe
- Mute
- Subscribe to RSS Feed
- Permalink
- Report Inappropriate Content
Can you try this
MinString({$<Response_% = p([Company name])>} Aggr(
  Rank(Sum({<Response_%, QuestionID_% = {'Q1'} ,[Cle2_%] = {'111'}>} [Weighting_factor_%]))
, [Response_%]))
- Mark as New
- Bookmark
- Subscribe
- Mute
- Subscribe to RSS Feed
- Permalink
- Report Inappropriate Content
What is the expression used in the chart and in the kpi object?
- Mark as New
- Bookmark
- Subscribe
- Mute
- Subscribe to RSS Feed
- Permalink
- Report Inappropriate Content
My expression is:
Only({$<Response_% = {"$(=GetFieldSelections([Company name]))"}>}
aggr({<Response_%>}rank(
SUM({<Response_%>}{<QuestionID_% = {'Q1'} ,[Cle2_%] = {'111'} >} [Weighting_factor_%])
/
SUM(TOTAL {<Response_%>} {<QuestionID_% = {'Q1'} ,[Cle2_%] = {'111'} >}Weighting_factor_%) ), [Response_%]))
Thanks
- Mark as New
- Bookmark
- Subscribe
- Mute
- Subscribe to RSS Feed
- Permalink
- Report Inappropriate Content
Can you try this
MinString({$<Response_% = p([Company name])>} Aggr(
  Rank(Sum({<Response_%, QuestionID_% = {'Q1'} ,[Cle2_%] = {'111'}>} [Weighting_factor_%]))
, [Response_%]))
- Mark as New
- Bookmark
- Subscribe
- Mute
- Subscribe to RSS Feed
- Permalink
- Report Inappropriate Content
Thanks!
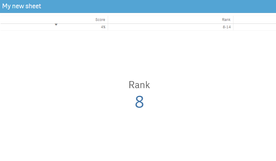
I still just get the lowest value in the KPI chart, but the range in the table:
- Mark as New
- Bookmark
- Subscribe
- Mute
- Subscribe to RSS Feed
- Permalink
- Report Inappropriate Content
Change Number Formatting to Measure expression
- Mark as New
- Bookmark
- Subscribe
- Mute
- Subscribe to RSS Feed
- Permalink
- Report Inappropriate Content
Fab! thanks very much


