Unlock a world of possibilities! Login now and discover the exclusive benefits awaiting you.
- Qlik Community
- :
- Forums
- :
- Analytics
- :
- New to Qlik Analytics
- :
- Regarding Pie chart
- Subscribe to RSS Feed
- Mark Topic as New
- Mark Topic as Read
- Float this Topic for Current User
- Bookmark
- Subscribe
- Mute
- Printer Friendly Page
- Mark as New
- Bookmark
- Subscribe
- Mute
- Subscribe to RSS Feed
- Permalink
- Report Inappropriate Content
Regarding Pie chart
Hi team,
Am new to qlik sense . I need to create one pie chart based on below requirement.
For example my pivot table contains 4 fields like item id,vendor_name ,Buyer_name,Spend_Amount,when I have to create pie chart it will not show item id.It should show vendor_name and Spend_amount.
Thanks in advance.
Thanks,
Srujana.
- « Previous Replies
-
- 1
- 2
- Next Replies »
- Mark as New
- Bookmark
- Subscribe
- Mute
- Subscribe to RSS Feed
- Permalink
- Report Inappropriate Content
Hi Rahul,
I am expecting one more help from you, Am using transpose functionality in Pivot table .its working fine but when we convert bar chart its not working. Please find the attached screen shot 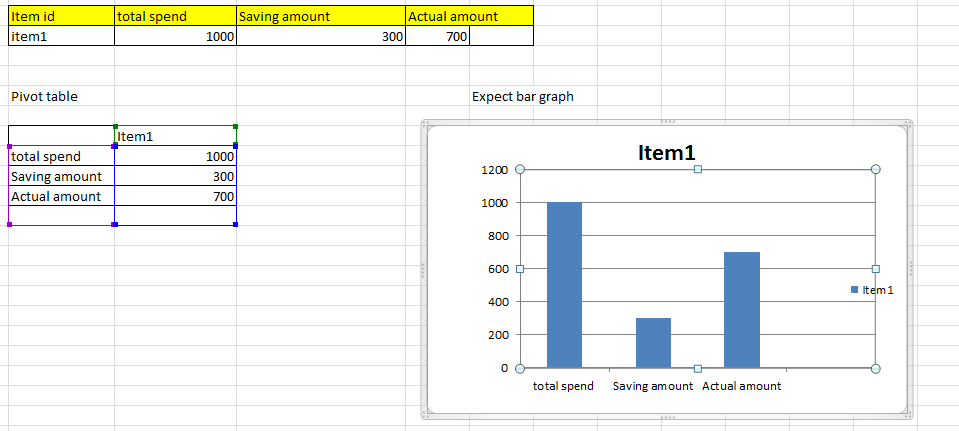
Thanks,
Srujana.
- Mark as New
- Bookmark
- Subscribe
- Mute
- Subscribe to RSS Feed
- Permalink
- Report Inappropriate Content
Hello Srujana,
Please follow below steps:
1. Load the data using CrossTable functionality
NewData:
CrossTable(Type, Amount)
LOAD * INLINE [
Item Id, Total Spend, Savings Amount, Actual Amount
Item1, 1000, 300, 700
];
2. Create new Bar Chart with Type as Dimension and Sum(Amount) as Measure
3. Create a Pivot Table with Type as Row and Sum(Amount) as Measure
Hope this will be helpful.
Regards!
Rahul
- Mark as New
- Bookmark
- Subscribe
- Mute
- Subscribe to RSS Feed
- Permalink
- Report Inappropriate Content
Hi Rahul,
Thanks for your reply.
I have data in excel already, based on data am created a pivot table.Its working fine now we have to convert this pivot to bar chart.But in this case we didn't get the bar chart as per our data,Item id is taken in X-axis and Savings are taken in Y-axis.In our case item_id taken in Y-axis and savings are taken in x_axis.Please find the screen shot.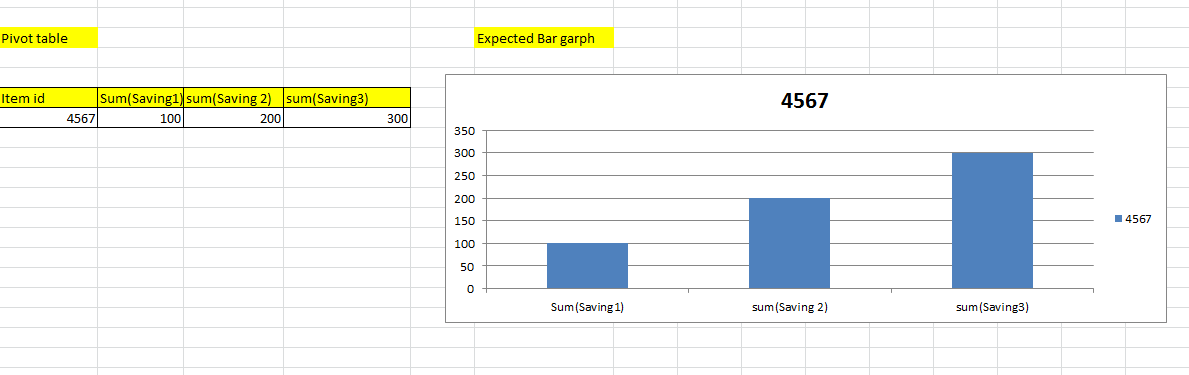
- Mark as New
- Bookmark
- Subscribe
- Mute
- Subscribe to RSS Feed
- Permalink
- Report Inappropriate Content
Hello Srujana,
Could you please share your application with sample data?
Regards!
Rahul
- « Previous Replies
-
- 1
- 2
- Next Replies »