Unlock a world of possibilities! Login now and discover the exclusive benefits awaiting you.
- Qlik Community
- :
- Forums
- :
- Analytics
- :
- New to Qlik Analytics
- :
- Re: Resources on Schedule Servers are low by the e...
- Subscribe to RSS Feed
- Mark Topic as New
- Mark Topic as Read
- Float this Topic for Current User
- Bookmark
- Subscribe
- Mute
- Printer Friendly Page
- Mark as New
- Bookmark
- Subscribe
- Mute
- Subscribe to RSS Feed
- Permalink
- Report Inappropriate Content
Resources on Schedule Servers are low by the end of the week
Hi Techies,
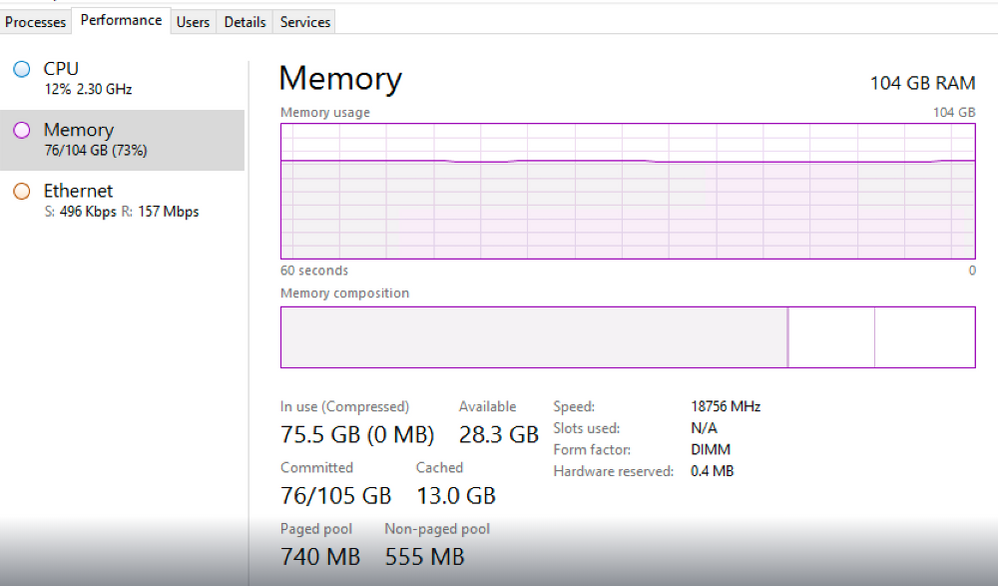
We have multi node site which has two consumer nodes, central and two scheduler nodes. Scheduler nodes have 104 GB and 32 cores.
We do weekly reboot to reset the Qlik servers.
Qmc=> Max Memory Usage =90
Qmc=> Min Memory Usage =70
At end of week, we have noticed that Memory is almost full which makes our large or heavy apps fail. We usually get error "Internal Server Error" or if we check Windows logs then it shows there was resources shortage on time of failure.
As per my knowledge Qlik keeps Min Memory Usage =70% RAM full but what is the best way to handle the Qlik system when RAM is 70% full and it needs to reload large app?
We are avoiding to introduce another service restart before weekly schedule reboot.
Any suggestion is welcome
Thanks,
Rohit
- Mark as New
- Bookmark
- Subscribe
- Mute
- Subscribe to RSS Feed
- Permalink
- Report Inappropriate Content
Hi @rohitk1609
Interesting issue, I searched the Qlik Community for similar issues and found this topic: Memory usage is constantly at 100% utilization; the accepted solution point to Qlik and Ballooning; this clue leads to the following knowledge article: Virtualization Best Practices In QlikView And Qlik Sense; although, you did not mention virtualization describing your problem; this could be a false lead.
Another approach is to monitor your Qlik memory usage per application in those servers, I found these articles providing enough information to monitor memory usage per application: Qlik Sense: determine memory usage per application this article direct us to How to enable Qlik Sense QIX performance and telemetry logging the later article suggest reading this one Logging; certainly this requires implementing memory monitoring task and it does not point directly to the bolt and nuts you need to adjust.
Hope this helps,
A journey of a thousand miles begins with a single step.
- Mark as New
- Bookmark
- Subscribe
- Mute
- Subscribe to RSS Feed
- Permalink
- Report Inappropriate Content
Hi Arnado,
Thanks for your important note. Let me share my note as response:
1. If you check the snapshot attached in original post, Memory consumption have been staying at 70%. It was not the case of 100% memory crash problem.
This 70% consumption stays due to QMC=>Engine=>Min Memory Usage.
2. The article you shared says "Never allow floating allocations of memory to avoid ballooning". I never saw shrink or contact memory. Our server size is fix. Yes consumption goes up and down on app execution.
3. We have enabled "allow paging file on all drives" to improve performance
4. The same article says "Never use poorly performing hardware (i.e. non whitelisted)", how come I prove that my server has good quality?
Thanks,
Rohit
