Unlock a world of possibilities! Login now and discover the exclusive benefits awaiting you.
- Qlik Community
- :
- Forums
- :
- Analytics
- :
- New to Qlik Analytics
- :
- Re: SAMEPERIODLASTYEAR function in Qlik Sense.
- Subscribe to RSS Feed
- Mark Topic as New
- Mark Topic as Read
- Float this Topic for Current User
- Bookmark
- Subscribe
- Mute
- Printer Friendly Page
- Mark as New
- Bookmark
- Subscribe
- Mute
- Subscribe to RSS Feed
- Permalink
- Report Inappropriate Content
SAMEPERIODLASTYEAR function in Qlik Sense.
In power BI there is a function called "SAMEPERIODLASTYEAR", it allows to show in a timeline the value of a metric compared to the previous year, I am trying to do something similar in Qlik Sense and I can't find the way, I attach an image of it what you want to do.
- Subscribe by Topic:
-
Chart
-
Developers
-
dimension
-
expression
-
filter
-
General Question
-
Script
-
Set Analysis
-
Variables
-
Visualization
Accepted Solutions
- Mark as New
- Bookmark
- Subscribe
- Mute
- Subscribe to RSS Feed
- Permalink
- Report Inappropriate Content
The scales are really off though

The only solution is a backend one, to create a custom grouping which associates previous year data to current year,
Refer below screenshot , example ; highlighted Feb 2020 is associated to both Feb 2019 and Feb 2020 data

.png)
Calendar:
Load
Date
,MonthName(Date) as Month_
,Year(Date) as Year_
;
load addmonths(date#('2019-01-01','YYYY-MM-DD'),recno()) as Date
Autogenerate(36);


randomdata:
Load Date,ceil(Rand()*1000) as Sales
Resident Calendar;

Period:
Load Date
,Text(Monthname(Monthstart(Date))) as Period
,'CY' as PeriodType
Resident Calendar;
Concatenate(Period)
 // associate previous year date to current year
Load
Monthstart(addyears(Date,-1)) as Date
,Text(Monthname(Monthstart(Date)))  as Period
,'PY' as PeriodType
Resident Calendar

;

exit Script;
Dimension:
Period
Measures
Sum({<PeriodType={'CY'},Year_={">=2020"}>} Sales)
Sum({<PeriodType={'PY'},Year_={">=2020"}>} Sales)
If a post helps to resolve your issue, please accept it as a Solution.
- Mark as New
- Bookmark
- Subscribe
- Mute
- Subscribe to RSS Feed
- Permalink
- Report Inappropriate Content
Current YearTodate
=sum({<Datefield={">=$(=Date(Yearstart(Max(Datefield))))<=$(=Date(Max(Datefield)))"}>}Sales)
Previous YearToDate
=sum({<Datefield={">=$(=Date(Yearstart(Max(Datefield),-1)))<=$(=Date(addyears(Max(Datefield),-1)))"}>}Sales)
use AddYears() or YearStart() function to offset years
If a post helps to resolve your issue, please accept it as a Solution.
- Mark as New
- Bookmark
- Subscribe
- Mute
- Subscribe to RSS Feed
- Permalink
- Report Inappropriate Content
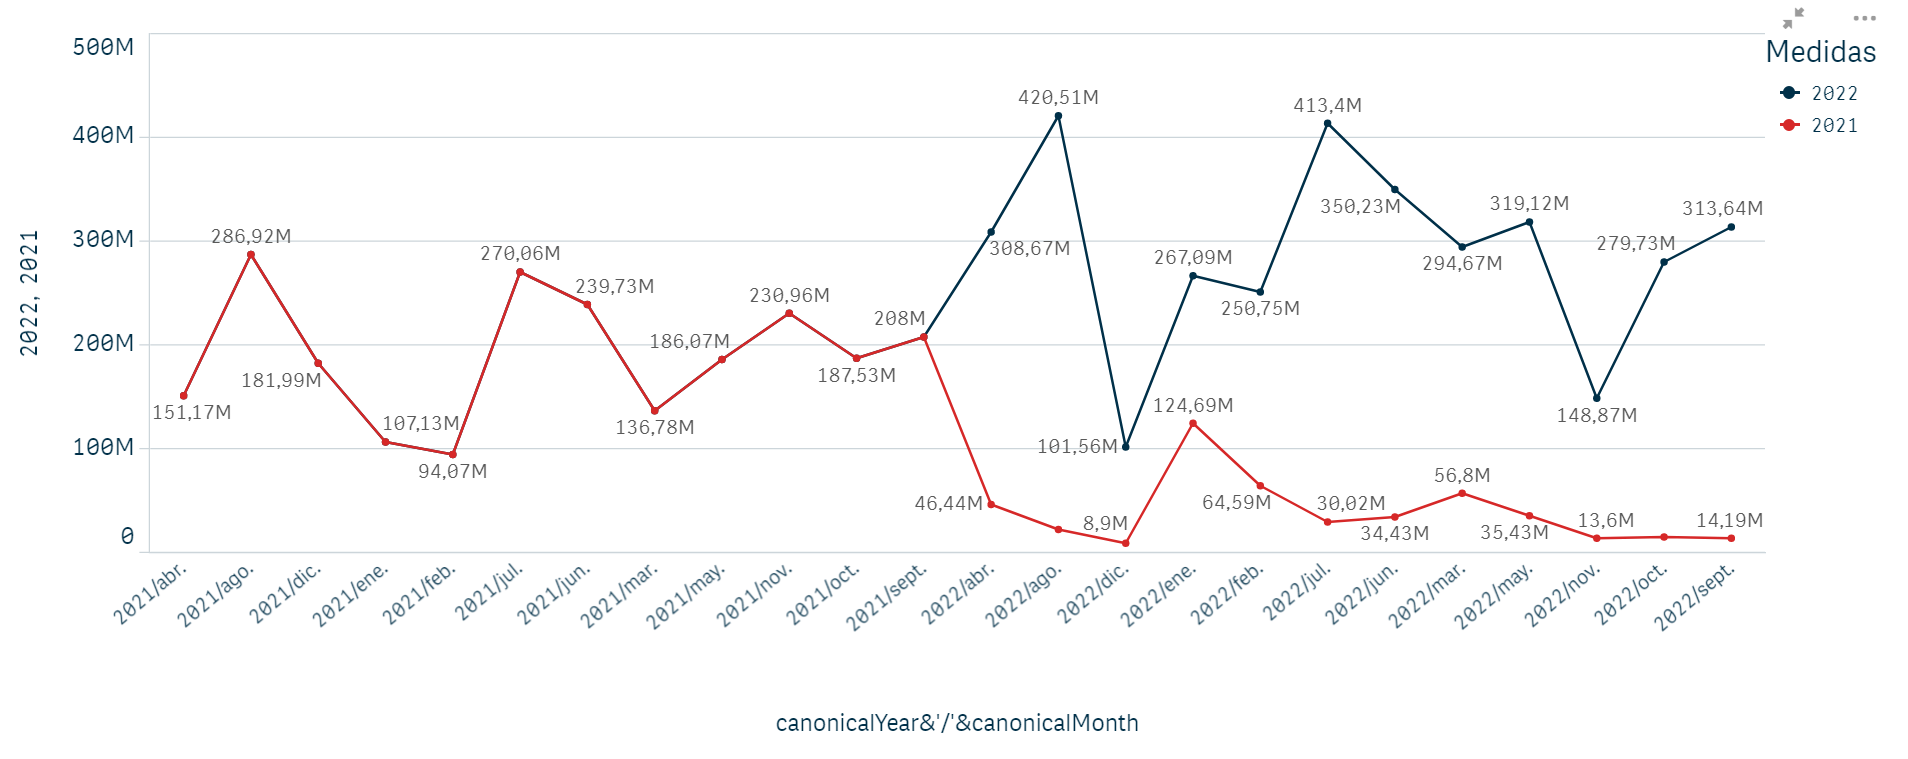
I apply the formulas that they tell me but the lines overlap in the graph, these are the formulas applied to my model.
Current YearTodate:
=sum({<[reservation_date_hotel.cal.Year]={">=$(=Date(Yearstart(Min([reservation_date_hotel.cal.Year]),-0)))<=$(=Date(addyears(Max([reservation_date_hotel.cal.Year]),-0)))"}>}amount_produced)
Previous YearToDate:
=sum({<[reservation_date_hotel.cal.Year]={">=$(=Date(Yearstart(Min([reservation_date_hotel.cal.Year]),-1)))<=$(=Date(addyears(Max([reservation_date_hotel.cal.Year]),-1)))"}>}amount_produced)
I attach an image of how the lines overlap in my example.
- Mark as New
- Bookmark
- Subscribe
- Mute
- Subscribe to RSS Feed
- Permalink
- Report Inappropriate Content
Just use CanonicalMonth as Dimension, remove Year from dimension
If a post helps to resolve your issue, please accept it as a Solution.
- Mark as New
- Bookmark
- Subscribe
- Mute
- Subscribe to RSS Feed
- Permalink
- Report Inappropriate Content
But if I delete the year, it won't show me the information in years, isn't there a way to see that comparison in months and years just like I show it in the image?
.png)
- Mark as New
- Bookmark
- Subscribe
- Mute
- Subscribe to RSS Feed
- Permalink
- Report Inappropriate Content
The scales are really off though
The only solution is a backend one, to create a custom grouping which associates previous year data to current year,
Refer below screenshot , example ; highlighted Feb 2020 is associated to both Feb 2019 and Feb 2020 data
Calendar:
Load
Date
,MonthName(Date) as Month_
,Year(Date) as Year_
;
load addmonths(date#('2019-01-01','YYYY-MM-DD'),recno()) as Date
Autogenerate(36);


randomdata:
Load Date,ceil(Rand()*1000) as Sales
Resident Calendar;

Period:
Load Date
,Text(Monthname(Monthstart(Date))) as Period
,'CY' as PeriodType
Resident Calendar;
Concatenate(Period)
 // associate previous year date to current year
Load
Monthstart(addyears(Date,-1)) as Date
,Text(Monthname(Monthstart(Date)))  as Period
,'PY' as PeriodType
Resident Calendar

;

exit Script;
Dimension:
Period
Measures
Sum({<PeriodType={'CY'},Year_={">=2020"}>} Sales)
Sum({<PeriodType={'PY'},Year_={">=2020"}>} Sales)
If a post helps to resolve your issue, please accept it as a Solution.