Unlock a world of possibilities! Login now and discover the exclusive benefits awaiting you.
- Qlik Community
- :
- Forums
- :
- Analytics
- :
- New to Qlik Analytics
- :
- Re: Sales from top 10 location Vs Total Sales in G...
- Subscribe to RSS Feed
- Mark Topic as New
- Mark Topic as Read
- Float this Topic for Current User
- Bookmark
- Subscribe
- Mute
- Printer Friendly Page
- Mark as New
- Bookmark
- Subscribe
- Mute
- Subscribe to RSS Feed
- Permalink
- Report Inappropriate Content
Sales from top 10 location Vs Total Sales in Gauge chart
Hi Experts,
Can you help me to get solution of implementing sales from top 10 locations vs total sales in gauge chart
Thanks ,
Pooja
- Mark as New
- Bookmark
- Subscribe
- Mute
- Subscribe to RSS Feed
- Permalink
- Report Inappropriate Content
Hi,
Can you attach sample data ? or a QVF ?
- Mark as New
- Bookmark
- Subscribe
- Mute
- Subscribe to RSS Feed
- Permalink
- Report Inappropriate Content
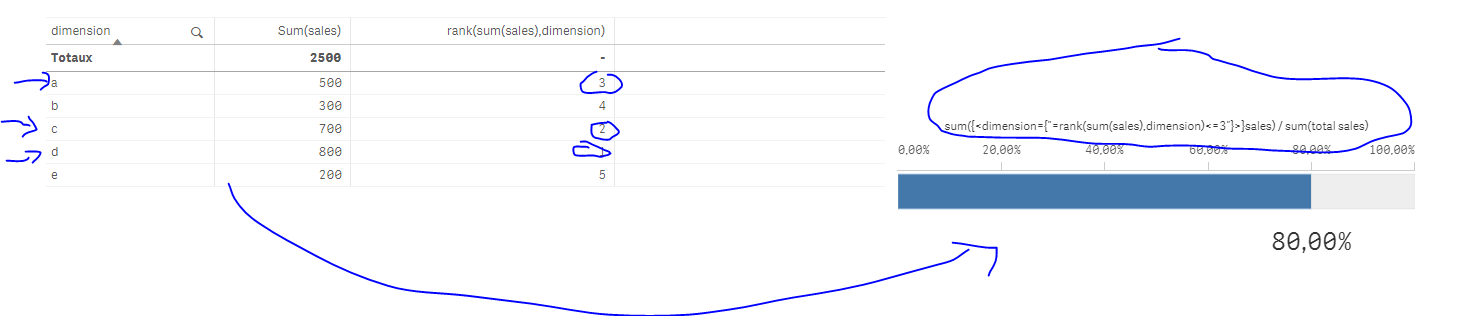
sum({<location={"=rank(sum(sales),location)<=10"}>}sales) / sum(total sales)
or
sum({<location={"=rank(sum({1}sales),location)<=10"}>}sales) / sum(total sales)
(depends on how u define top 10 locations)
ps: u can alter this :
sum(total sales)
as
sum(total {<location>} sales)
or
sum(all sales)
It all depends on what u're willing to analyze
Per analogy; here's top 3 vs Total : (a,c and d)
- Mark as New
- Bookmark
- Subscribe
- Mute
- Subscribe to RSS Feed
- Permalink
- Report Inappropriate Content
Thanks for your help bud has not worked as I wanted.
Thanks,
Pooja
- Mark as New
- Bookmark
- Subscribe
- Mute
- Subscribe to RSS Feed
- Permalink
- Report Inappropriate Content
It all depend on what u have.
Can u share a screenshot of what u had using this? and what u're expecting maybe?