Unlock a world of possibilities! Login now and discover the exclusive benefits awaiting you.
- Qlik Community
- :
- Forums
- :
- Analytics
- :
- New to Qlik Analytics
- :
- Re: Scatter plot and Line Chart accumulated
- Subscribe to RSS Feed
- Mark Topic as New
- Mark Topic as Read
- Float this Topic for Current User
- Bookmark
- Subscribe
- Mute
- Printer Friendly Page
- Mark as New
- Bookmark
- Subscribe
- Mute
- Subscribe to RSS Feed
- Permalink
- Report Inappropriate Content
Scatter plot and Line Chart accumulated
Hi,
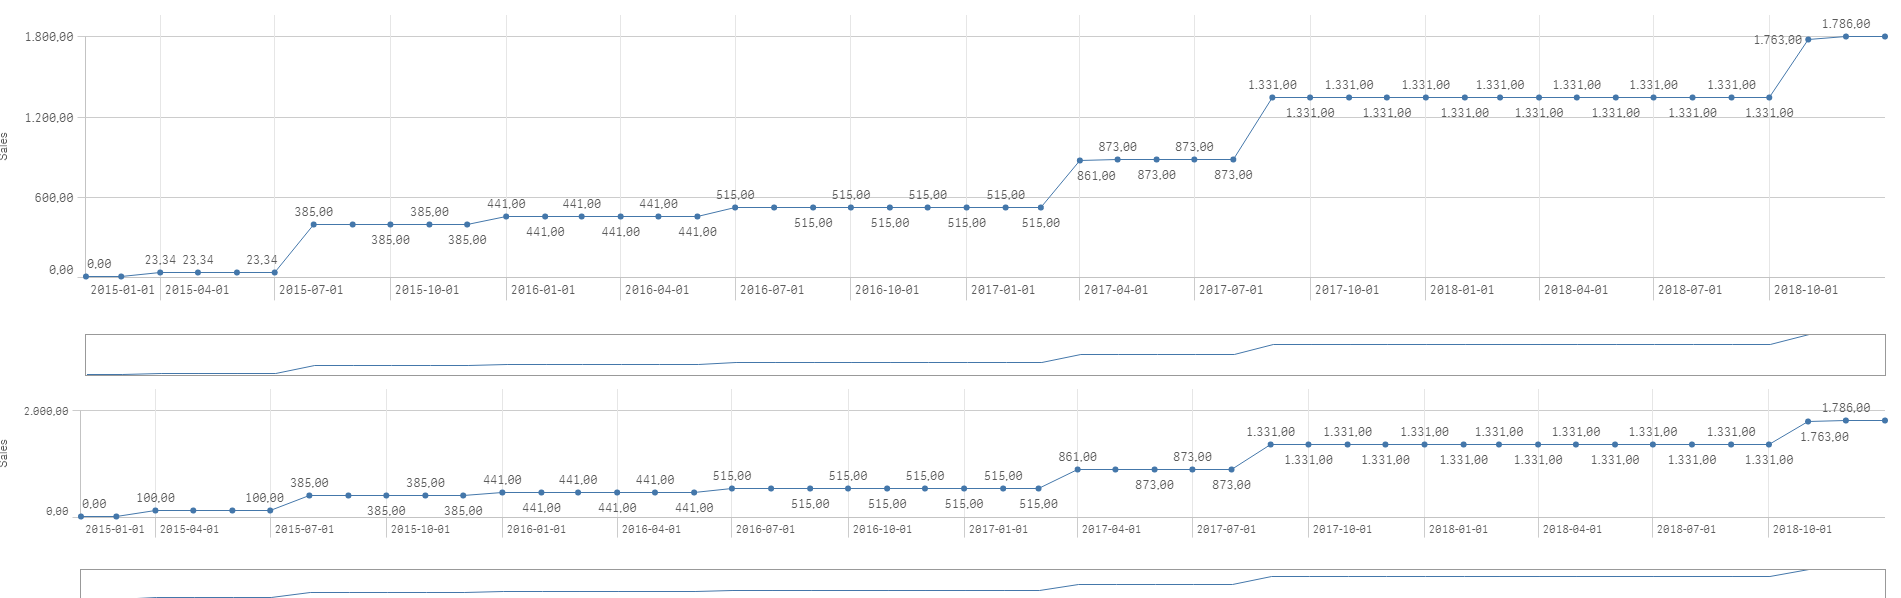
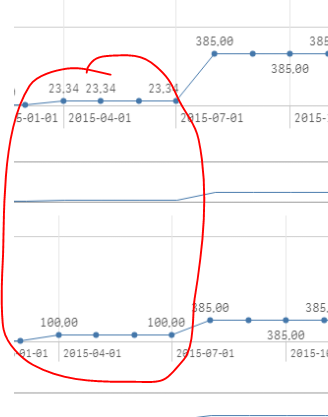
I need some help with two charts. On the one hand, I have a line chart that shows the accumulated amount on each end of the month date. I have created a calendar that takes me all the previous dates of each end of the month. In the graph of lines below in original currency works correctly. In the top one I added the exchange rate and I no longer get the accumulated amount.
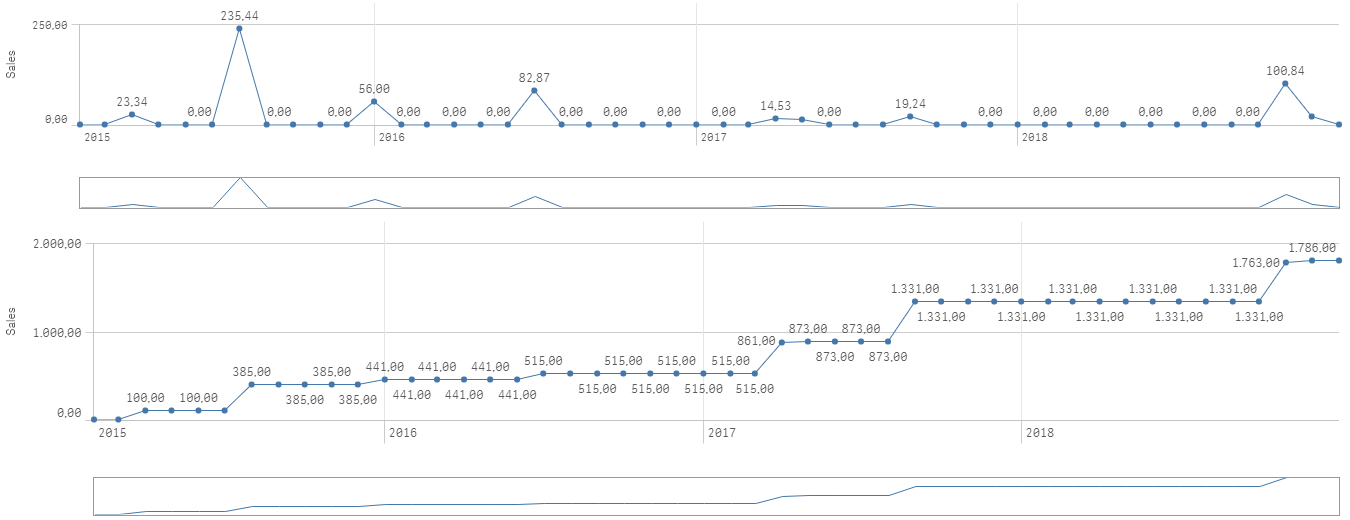
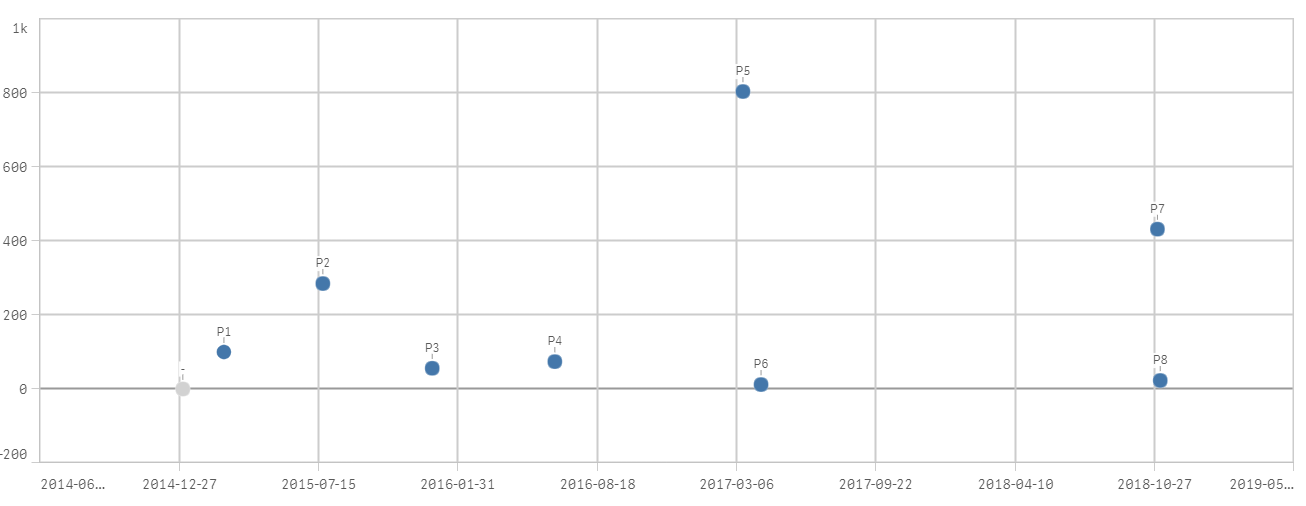
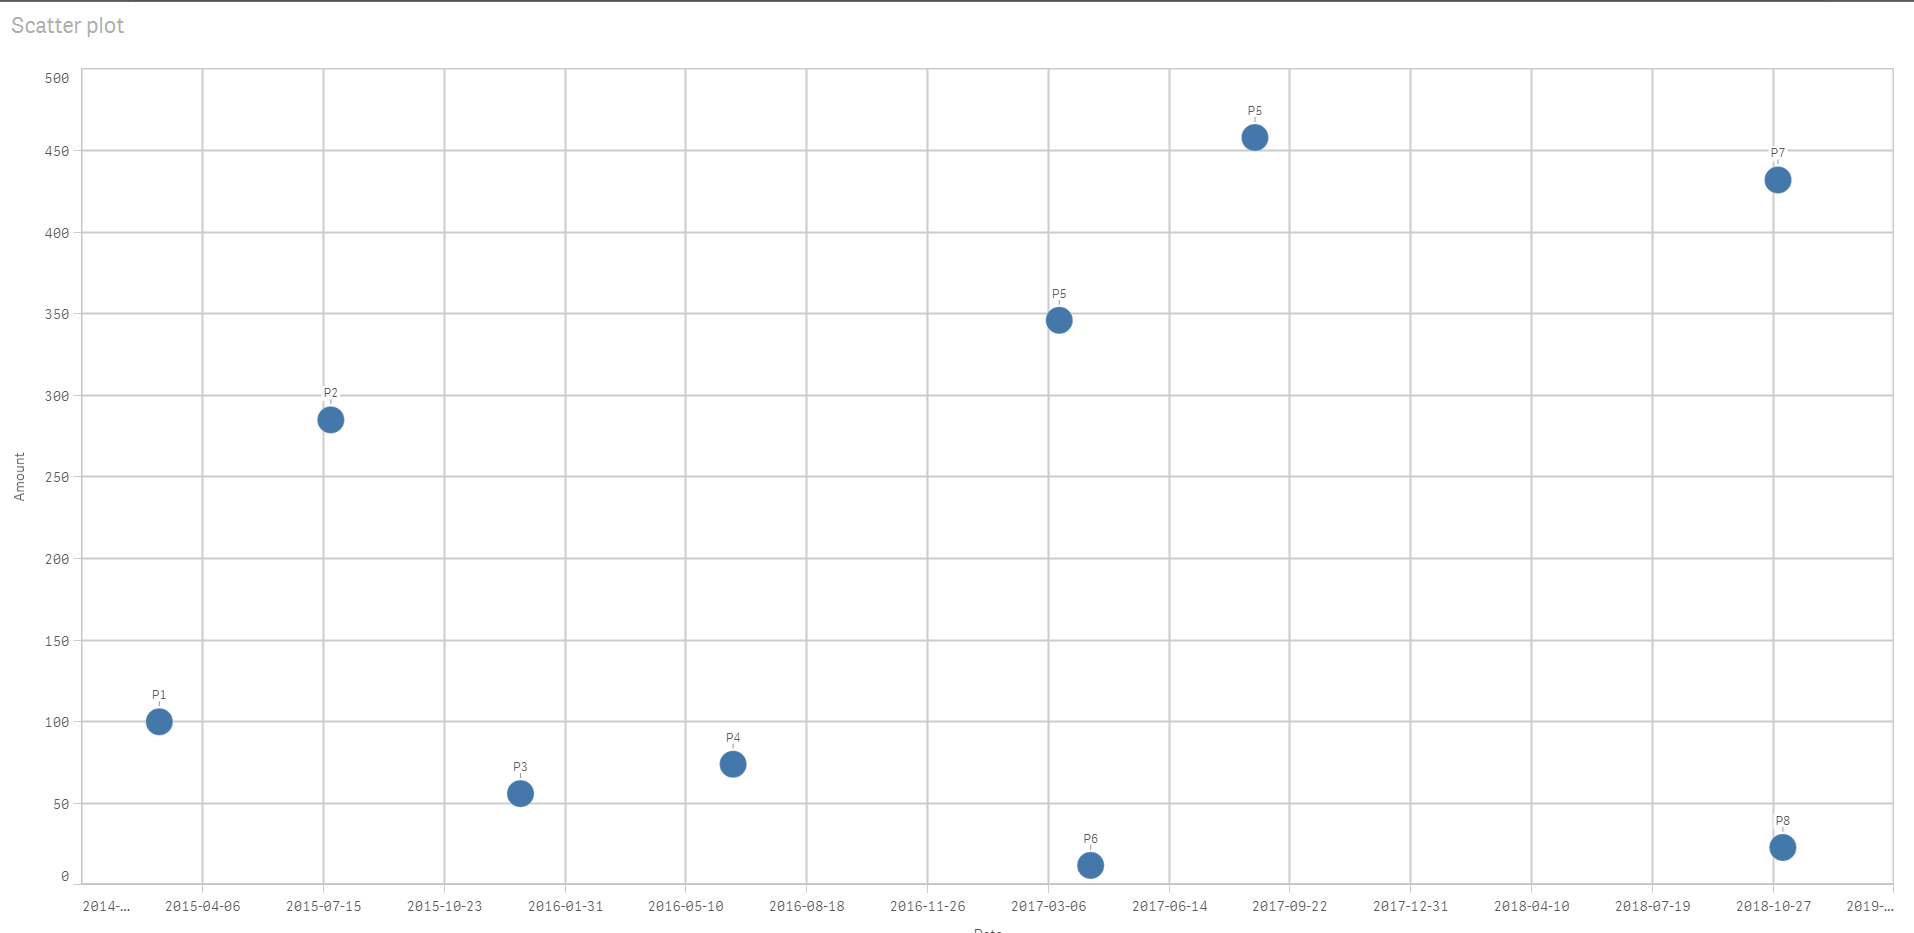
On the other hand, I have a scatter chart. The program P5 exists twice with different amounts and dates but only appears once and I would need to show two with the different amounts and dates.
I attach a qvf with the 2 charts.
Thank you very much in advance.
- « Previous Replies
-
- 1
- 2
- Next Replies »
- Mark as New
- Bookmark
- Subscribe
- Mute
- Subscribe to RSS Feed
- Permalink
- Report Inappropriate Content
May be using this
Sum(AMOUNT)*$(vFXRates)
- Mark as New
- Bookmark
- Subscribe
- Mute
- Subscribe to RSS Feed
- Permalink
- Report Inappropriate Content
It's not working because it dowsn't calculated well the exchange rate for all the programs. In fact the two charts ends with the same result which it's not correct
- Mark as New
- Bookmark
- Subscribe
- Mute
- Subscribe to RSS Feed
- Permalink
- Report Inappropriate Content
Use this as your dimension
=Dual(PROGRAM, DATE)
- Mark as New
- Bookmark
- Subscribe
- Mute
- Subscribe to RSS Feed
- Permalink
- Report Inappropriate Content
Some of the values are different
- Mark as New
- Bookmark
- Subscribe
- Mute
- Subscribe to RSS Feed
- Permalink
- Report Inappropriate Content
only the first program calculates its exchange rate well the rest are wrong
- Mark as New
- Bookmark
- Subscribe
- Mute
- Subscribe to RSS Feed
- Permalink
- Report Inappropriate Content
thanks it works!
- Mark as New
- Bookmark
- Subscribe
- Mute
- Subscribe to RSS Feed
- Permalink
- Report Inappropriate Content
Is this not a problem in the below chart?
- Mark as New
- Bookmark
- Subscribe
- Mute
- Subscribe to RSS Feed
- Permalink
- Report Inappropriate Content
No, the below chart is in original currency top chart should be in euros.
- Mark as New
- Bookmark
- Subscribe
- Mute
- Subscribe to RSS Feed
- Permalink
- Report Inappropriate Content
What numbers do you expect to see on the top chart? We see 23.34 right now for 2015-04-01... what should it be?
- « Previous Replies
-
- 1
- 2
- Next Replies »